我认为使用面向方面的方法是可以的:
library(ggplot2)
library(gtable)
library(grid)

df <- data.frame(main.cat = c("A", "A", "B", "B", "B", "C"),
                 second.cat = c("a1", "a2", "b1", "b2", "b3", "c1"),
                 value = c(2, 3, 4, 2.5, 1.5, 2.3))

p = ggplot(data = df, aes(x = second.cat, y = value)) +
   geom_point() + facet_grid(.~main.cat, space = "free_x", scales = "free_x") +
   theme(strip.background = element_rect(fill = NA))
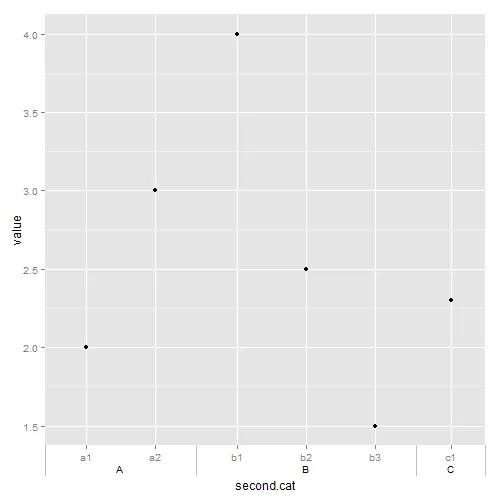
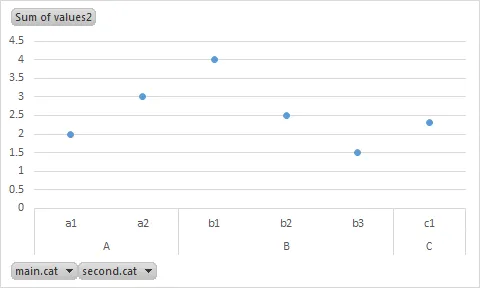
但是如果你想要更接近Excel的外观,一种方法是使用gtable函数来提取条带并将其插入到刻度标记标签下方,然后在主要类别之间插入一些边界线。请注意,下面的代码是针对您的示例数据而编写的。
p = p + theme(panel.spacing = unit(0, "lines"))
g = ggplotGrob(p)
gtable_show_layout(g)
g = gtable_add_rows(g, g$height[7], 9)
stripGrob = gtable_filter(g, "strip")
g = gtable_add_grob(g, stripGrob, 10, 5, 10, 9)
g = g[-7, ]
linesGrob = linesGrob(gp = gpar(col = "grey75"))
for(i in c(6,8)) g = gtable_add_grob(g, linesGrob, t=8, l=i, b=9, r=i)
for(i in c(4, 10)) {
g = gtable_add_cols(g, unit(0, "lines"), i)
g = gtable_add_grob(g, linesGrob, t=8, l=i+1, b=9, r=i+1)
}
grid.newpage()
grid.draw(g)
编辑 一个粗略的尝试通用化
library(ggplot2)
library(gtable)
library(grid)
df <- data.frame(main.cat = c("A", "A", "B", "B", "C", "D"),
second.cat = c("a1", "a2", "b1", "b2", "c1", "d1"),
value = c(2, 3, 4, 2.5, 1.5, 2.3))
p = ggplot(data = df, aes(x = second.cat, y = value)) +
geom_point() + facet_grid(.~main.cat, space = "free_x", scales = "free_x") +
theme(strip.background = element_rect(fill = NA))
p = p + theme(panel.spacing = unit(0, "lines"))
g = ggplotGrob(p)
gtable_show_layout(g)
panels <- c(subset(g$layout, grepl("panel", g$layout$name), se=t:r))
stripGrob = gtable_filter(g, "strip")
height = stripGrob$height
g = gtable_add_rows(g, height, unique(panels$b+1))
g = gtable_add_grob(g, stripGrob,
t = unique(panels$b+2),
l = min(panels$l),
r = max(panels$r))
linesGrob = linesGrob(gp = gpar(col = "grey75"))
panelsR = panels$r[-length(panels$r)]
for(i in panelsR+1) g = gtable_add_grob(g, linesGrob,
t=unique(panels$b+1),
l=i,
b=unique(panels$b+2))
panelBound = c(4, max(panels$r)+1)
for(i in panelBound) {
g = gtable_add_cols(g, unit(0, "lines"), i)
g = gtable_add_grob(g, linesGrob,
t=unique(panels$b+1),
l=i+1,
b=unique(panels$b+2))
}
g = g[-7, ]
grid.newpage()
grid.draw(g)
gtable函数的笔记,可在https://github.com/baptiste/gtable/wiki/Description上找到。 - Sandy Muspratt