水平ggplot柱状图的标题、副标题和图例的对齐方式

29

我希望将ggplot2条形图中的plot.titleplot.subtitleplot.caption左对齐。

示例:

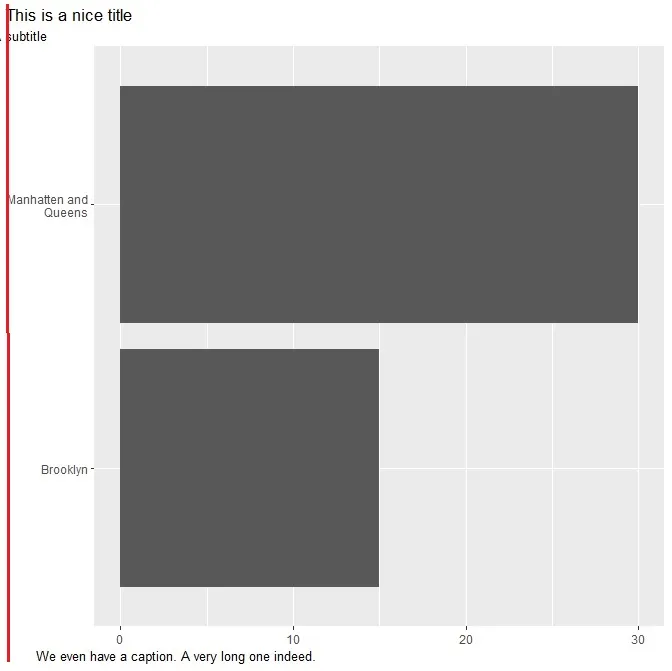
library("ggplot2") # ggplot2 2.2
df <- data.frame(type=factor(c("Brooklyn",
                               "Manhatten and\n Queens")),
                 value=c(15,30))

# manual hjust for title, subtitle & caption
myhjust <- -0.2

ggplot(df,
       aes(x=type, y=value)) +
  geom_bar(stat='identity') +
  coord_flip() +
  labs(
    title = "This is a nice title",
    subtitle = "A subtitle",
    caption  = "We even have a caption. A very long one indeed.") +
  theme(axis.title=element_blank(),
        plot.title=element_text(hjust = myhjust),
        plot.subtitle=element_text(hjust = myhjust ),
        plot.caption=element_text(hjust = myhjust))

如何对齐所有3个labs元素(plot.title, plot.subtitleplot.caption)到axis.text开始的位置(红色垂直线,"M" of Manhatten)?

另外: 为什么固定的myhjust会导致plot.titleplot.subtitleplot.caption有三个不同的水平位置?

Problem


6
这是一个很好的问题,阐述得很清楚明白。我在使用ggplot时经常遇到这个问题。虽然下面的grid.arrange()替代方案可行,但对我来说并不是完整的答案。例如,为什么相同的hjust值不会像标题、副标题和说明文字一样影响它们?我认为答案是每种情况下文本字符串的参考点都是中间位置。虽然对于居中对齐的文本这种方式很合理,但对于左对齐或右对齐超出绘图区域还需调整位置的文字就行不通了。看起来这应该是一个简单的设置。 - jzadra
2个回答

25
这个问题涉及到 tidyverse/ggplot2 的一个已解决的 github 问题: https://github.com/tidyverse/ggplot2/issues/3252 并且在 ggplot2(开发版本)中实现了这个功能: https://github.com/tidyverse/ggplot2/blob/15263f7580d6b5100989f7c1da5d2f5255e480f9/NEWS.md 主题增加了两个新参数,plot.title.position 和 plot.caption.position,可以用来自定义标题/副标题和图表说明与整个图表的相对位置(@clauswilke, #3252)。
为了遵循你的示例作为 reprex:
# First install the development version from GitHub:
#install.packages("devtools") #If required
#devtools::install_github("tidyverse/ggplot2")

library(ggplot2)
packageVersion("ggplot2")
#> [1] '3.2.1.9000'

df <- data.frame(type=factor(c("Brooklyn","Manhatten and\n Queens")),
                 value=c(15,30))

ggplot(df, aes(x=type, y=value)) +
  geom_bar(stat='identity') +
  coord_flip() +
  labs(title = "This is a nice title",
       subtitle = "A subtitle",
       caption  = "We even have a caption. A very long one indeed.") +
  theme(plot.caption = element_text(hjust = 0, face= "italic"), #Default is hjust=1
        plot.title.position = "plot", #NEW parameter. Apply for subtitle too.
        plot.caption.position =  "plot") #NEW parameter

这段代码是由reprex包(v0.3.0)创建于2019-09-04


12

虽然你可以编辑这三个grobs,但你也可以只需执行以下操作:

library(gridExtra)
library(grid)

grid.arrange(
  textGrob("This is a nice title", 
           gp=gpar(fontsize=16, col="#2b2b2b"), 
           x=unit(0.005, "npc"), just=c("left", "bottom")),
  textGrob("A subtitle",  
           gp=gpar(fontsize=12, col="#2b2b2b"), 
           x=unit(0.005, "npc"), just=c("left", "bottom")),
  ggplot(df, aes(x=type, y=value)) +
    geom_bar(stat='identity') +
    coord_flip() +
    theme(axis.title=element_blank()),
  textGrob("We even have a caption. A very long one indeed.", 
           gp=gpar(fontsize=9, col="#2b2b2b"), 
           x=unit(0.005, "npc"), just=c("left", "bottom")),
  ncol=1,
  heights=c(0.075, 0.025, 0.85, 0.05)
)

为它制作一个包装器,将其放入个人包中。轻松完成。


library(ggplot2)
library(gridExtra)
library(grid)

df <- data.frame(type=factor(c("Brooklyn","Manhatten and\n Queens")), value=c(15,30))

ggplot(df, aes(x=type, y=value)) +
  geom_bar(stat='identity') +
  coord_flip() +
  theme(axis.title=element_blank()) +
  theme(plot.margin=margin(l=0, t=5, b=5))-> gg

flush_plot <- function(x, title, subtitle, caption) {
  tg <- function(label, ...) {
    textGrob(label,  x=unit(0, "npc"), just=c("left", "bottom"),
             gp=do.call(gpar, as.list(substitute(list(...)))[-1L])) }
  grid.arrange(
    tg(title, fontsize=16, col="#2b2b2b"),
    tg(subtitle, fontsize=12, col="#2b2b2b"), x,
    tg(caption, fontsize=9, col="#2b2b2b"),
    ncol=1, heights=c(0.075, 0.025, 0.85, 0.05)
  )
}

flush_plot(gg, "This is a nice title", "A subtitle", 
           "We even have a caption. A very long one indeed.")

这会对齐标题、副标题和说明,但好像不包括y轴标签。 - Chrisss
1
plot.margin = unit(c(0,0,0,0),"line") 可以修复这个问题。 - baptiste
1
@hrbrmstr 很棒的回答!但说实话:如果有纯ggplot2解决方案且代码更少的话,我更喜欢那个...如果有的话 /-: - chamaoskurumi

网页内容由stack overflow 提供, 点击上面的
可以查看英文原文,
原文链接