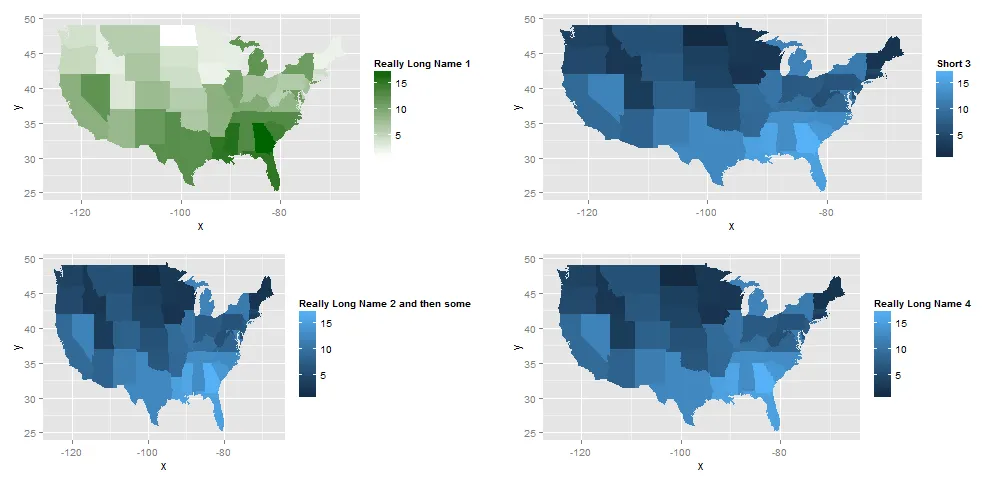
我正试图使用这种方法来对齐4个ggplot区域地图的左右边缘,但是我无法做到。
原始绘图:
library(ggplot2); library(gridExtra)
crimes <- data.frame(state = tolower(rownames(USArrests)), USArrests)
states_map <- map_data("state")
plot1 <- ggplot(crimes, aes(map_id = state)) +
    geom_map(aes(fill = Murder), map = states_map) +
    expand_limits(x = states_map$long, y = states_map$lat) +
    scale_fill_gradient(low="white", high="darkgreen", name="Really Long Name 1")


plot2 <- plot1 + scale_fill_gradient(name="Really Long Name 2 and then some")
plot3 <- plot1 + scale_fill_gradient(name="Short 3")
plot4 <- plot1 + scale_fill_gradient(name="Really Long Name 4")

grid.arrange(plot1, plot3, plot2, plot4, ncol = 2)
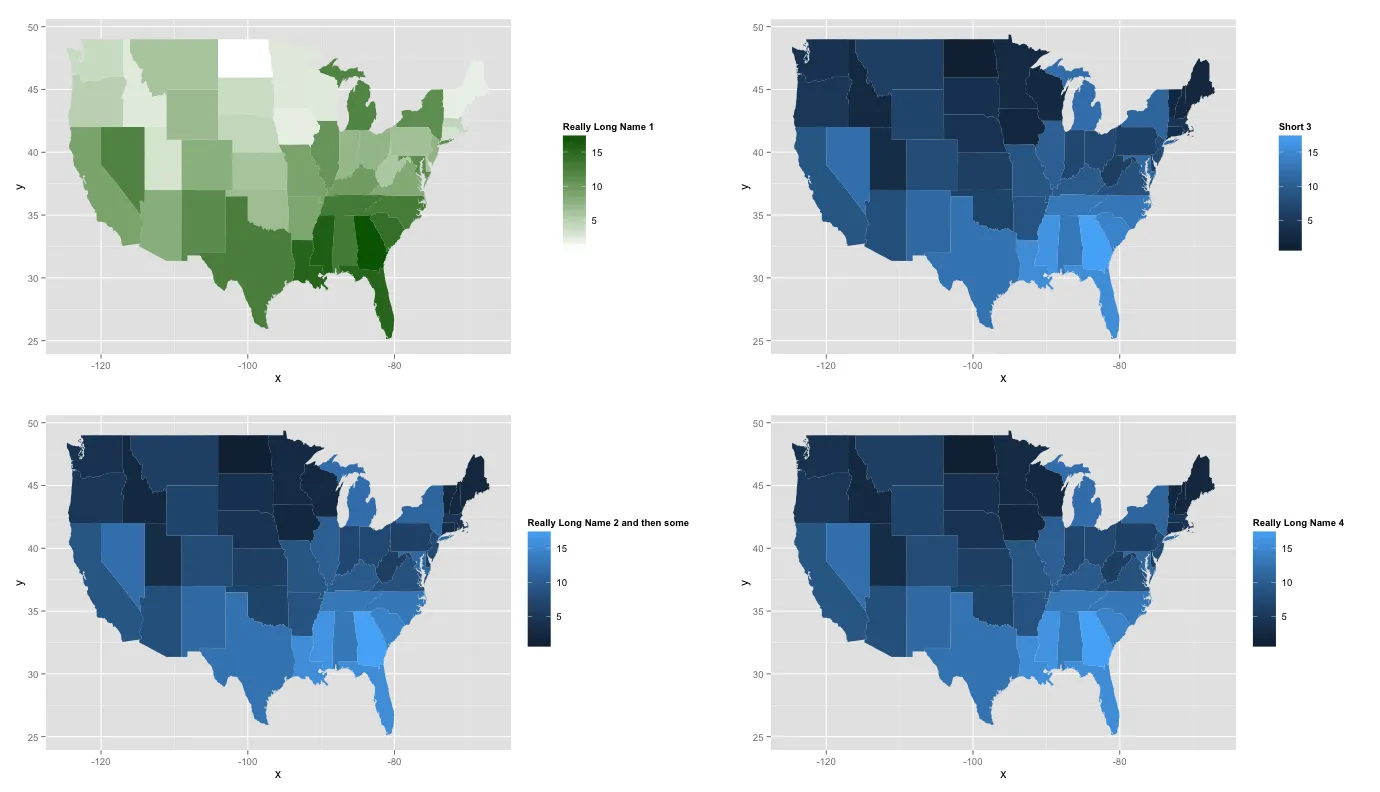
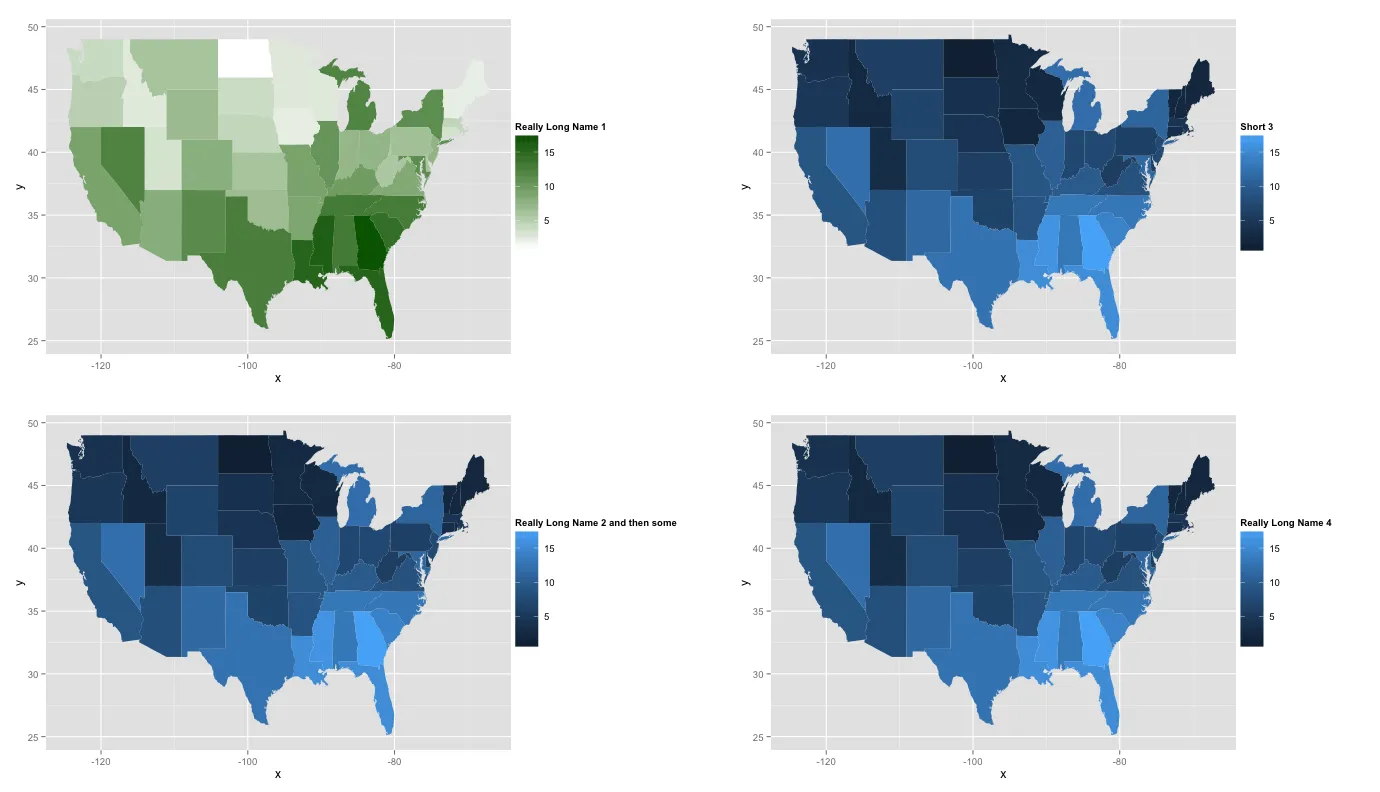
尝试对齐图形边缘(将得到相同的结果):
p1 <- ggplotGrob(plot1)
p2 <- ggplotGrob(plot2)
p3 <- ggplotGrob(plot3)
p4 <- ggplotGrob(plot4)

maxWidth <- grid::unit.pmax(p1$widths[2:3], p2$widths[2:3], p3$widths[2:3], p4$widths[2:3])
p1$widths[2:3] <- as.list(maxWidth)
p2$widths[2:3] <- as.list(maxWidth)
p3$widths[2:3] <- as.list(maxWidth)
p4$widths[2:3] <- as.list(maxWidth)

grid.arrange(p1, p3, p2, p4, ncol = 2)
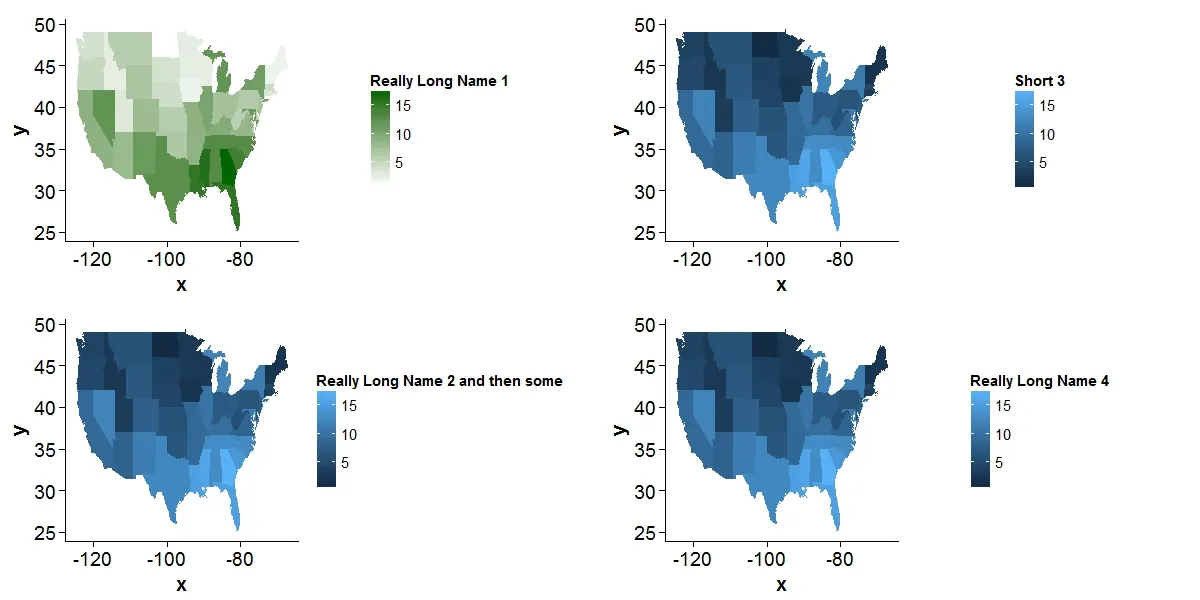
附注:假设我需要使用网格排列,并且图例实际上不是同一比例,因此facet_grid不适用等。
plot1 + theme(legend.position='bottom', legend.direction='horizontal')。 - MrGumblewidths[2:5]来包括图例以比较单位。请注意,这将导致与@kohske的第一个答案相同的图例居中,因为指南grob会在分配的视口中心自我居中。 - baptistewidths[2:5],但结果非常奇怪。 - Tyler Rinker