当我用R解决微分方程时,遇到了一个问题:我需要在我的图中添加等值线和方向场,但我不知道该如何做。我应该安装哪个软件包/调用哪个函数/还是手动完成?
3个回答
2
这里不是答案,只是评论中给出的回答总结:
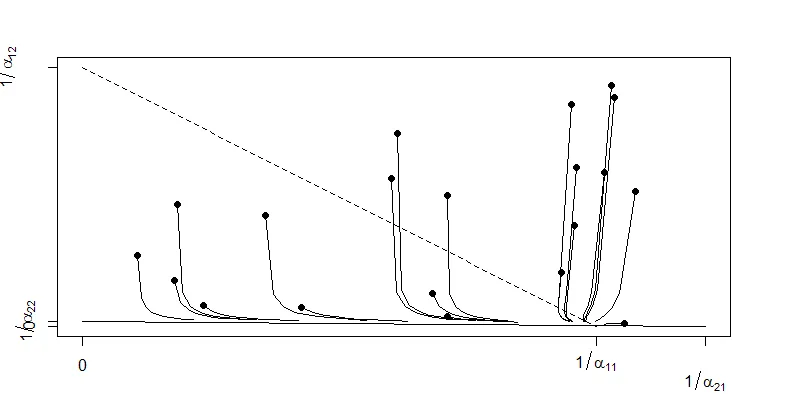
primer包中的LVCompGames函数会生成如下图所示:
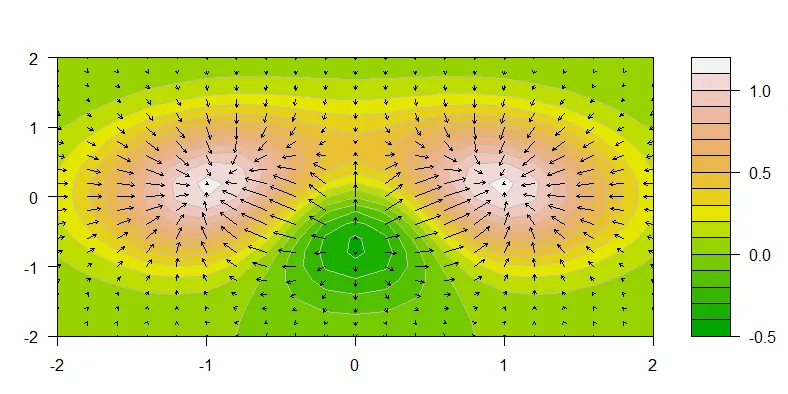
graphics包和filled.contour函数。
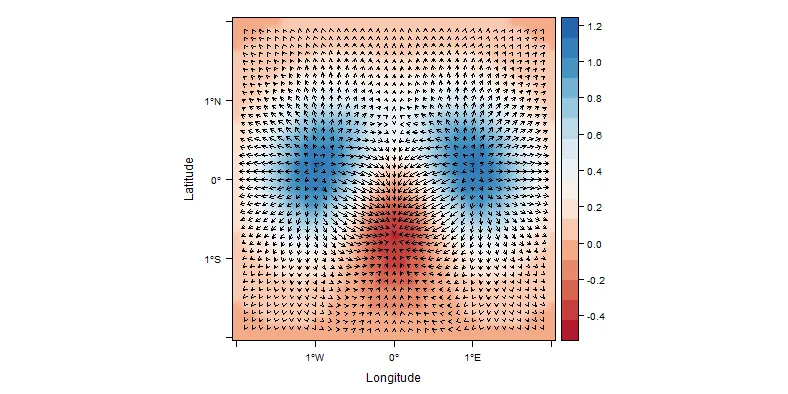
rasterVis 包中的 vectorplot 函数。
- agstudy
2
非常感谢您,您帮了我很多忙。真的很抱歉打扰您关于这个问题,现在我明白这并不是那么困难的了。再次感谢您,希望能为该网站做出贡献。 - user1955058
如果答案符合您的要求,您可以勾选答案左侧的复选框来接受它。不用客气。 - agstudy
1
有一个很棒的包叫做phaseR。它使用了deSolve包中的ODE求解器,让您可以轻松地添加零轴线、轨迹等等。
只需确保您的ODE函数参数命名为"t"、"y"和"parameters"。否则,phaseR函数将会报错:
以下是Lotka-Volterra掠食者-猎物系统的可用代码示例:Error in deriv(t = 0, y = c(x[i], y[j]), parameters = parameters) :
unused arguments (y = c(x[i], y[j]), parameters = parameters)
require(deSolve)
require(phaseR)

model.LV <- function(t, y, parameters){
  with(as.list(parameters),{

    N<-y[1]
    P<-y[2]
    dN <- a*N - b*N*P
    dP <- c*N*P -d*P

    list(c(dN,dP))
  })
}

params.LV<-c(a=0.4, b=0.3, c=0.1, d=0.2)

data.LV<-as.data.frame(lsoda(c(N=1,P=1),seq(1,250,by=0.5), model.LV, params.LV))
# plot the time series of both populations
plot(data.LV$time,data.LV$N, main="Time series of L-V equations", xlab="time",
     ylab="Population densities N, P",
     type="l", col="green",
     ylim=c(0,max(data.LV$N,data.LV$C)))
lines(data.LV$time,data.LV$P,col="red")

# plot the trajectories of the system
plot(data.LV$N, data.LV$P, type="l", col="blue", main="Trajectory of L-V equations",
     xlab="Prey density N", ylab="Predator density P", xlim=c(0,5), ylim=c(0,3))
#add Nullclines
nullclines(model.LV, x.lim=c(0.1,5),y.lim=c(0.1,3), parameters=params.LV, system="two.dim", colour=c("green","red"), add=TRUE)
- Owlright
0
TeachingDemos包中的
my.symbols函数允许您定义自己的符号以添加到现有图形中。支持函数ms.arrows已经编码了基本箭头以添加到图形中,您可以轻松修改它(或其他ms.函数)以创建不同的符号以添加。- Greg Snow
网页内容由stack overflow 提供, 点击上面的可以查看英文原文,
原文链接
原文链接
library('sos') findFn('isoclines')命令可以找到LVCompGames包,该包可以生成等值线和初始点的图形。 - agstudyprimer,而LVCompGames是等值线函数。 - agstudyvectorplot()和contourplot()。以下是一个示例:http://rastervis.r-forge.r-project.org/#vectorplot。(将margin=FALSE设置为抑制边缘分布的绘图。) - Josh O'Brien