我似乎无法弄清楚如何在图表标题的任何部分添加下划线。
我找到的最好办法是手工标记("segment"),并且我创建了一个玩具图表来说明它的方法。
df <- data.frame(x = 1:10, y = 1:10)
rngx <- 0.5 * range(df$x)[2] # store mid-point of plot based on x-axis value
rngy <- 0.5 * range(df$y)[2] # stores mid-point of y-axis for use in ggplot
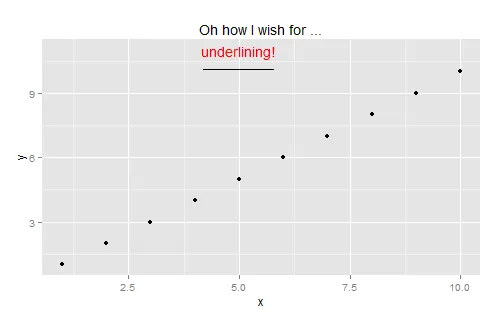
ggplot(df, aes(x = x, y = y)) +
geom_point() +
ggtitle("Oh how I wish for ..." ) +
ggplot2::annotate("text", x = rngx, y = max(df$y) + 1, label = "underlining!", color = "red") +
# create underline:
ggplot2::annotate("segment", x = rngx-0.8, xend = rngx + 0.8, y= 10.1, yend=10.1)
expression,为什么不使用expression(Oh~how~I~wish~for ~underline(underlining))。不需要经常令人困惑的 plotmathpaste()调用。 - IRTFMError: unexpected '~' in: "ggplot(df, aes(x = x, y = y)) + geom_point() + ggtitle(expression(Oh~how~I~wish~for ~"。我做错了吗? - Jotaexpression(Oh~how~I~wish~'for'~underline(underlining))。使用 "in" 单词也会出现同样的解析错误。 - IRTFMggtitle(~"哦,我多么渴望"*underline(加下划线))可能是最简单的。 - baptiste