我正在使用geopandas制作区域地图。我想要绘制具有两层边界的地图:国家层面的较细边界(geopandas默认)和各种经济共同体的较粗边界。在geopandas中是否可行?
以下是一个示例:
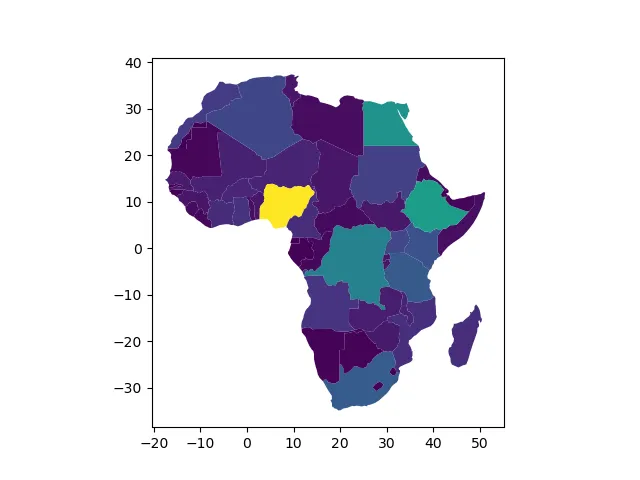
我已经为属于EAC组的国家创建了一个虚拟变量。我想在保留国家边界的同时,绘制一个更粗的边框来围绕这个组中的国家。
以下是一个示例:
import geopandas as gpd
import numpy as np
import matplotlib.pyplot as plt

world = gpd.read_file(gpd.datasets.get_path('naturalearth_lowres'))

africa = world.query('continent == "Africa"')

EAC = ["KEN", "RWA", "TZA", "UGA", "BDI"]

africa["EAC"] = np.where(np.isin(africa["iso_a3"], EAC), 1, 0)

africa.plot(column="pop_est")
plt.show()
我已经为属于EAC组的国家创建了一个虚拟变量。我想在保留国家边界的同时,绘制一个更粗的边框来围绕这个组中的国家。
编辑:
我仍然不知道如何在子图中使其工作。这是一个例子:
axs = ["ax1", "ax2"]
vars = ["pop_est", "gdp_md_est"]
fig, axs = plt.subplots(ncols=len(axs),
                        figsize=(10, 10),
                        sharex=True,
                        sharey=True,
                        constrained_layout=True)

for ax, var in zip(axs, vars):

    africa.plot(ax=ax,
                column=var,
                edgecolor="black",
                missing_kwds={
                    "color": "lightgrey",
                    "hatch": "///"
                })

    ax.set_title(var)

plt.show()
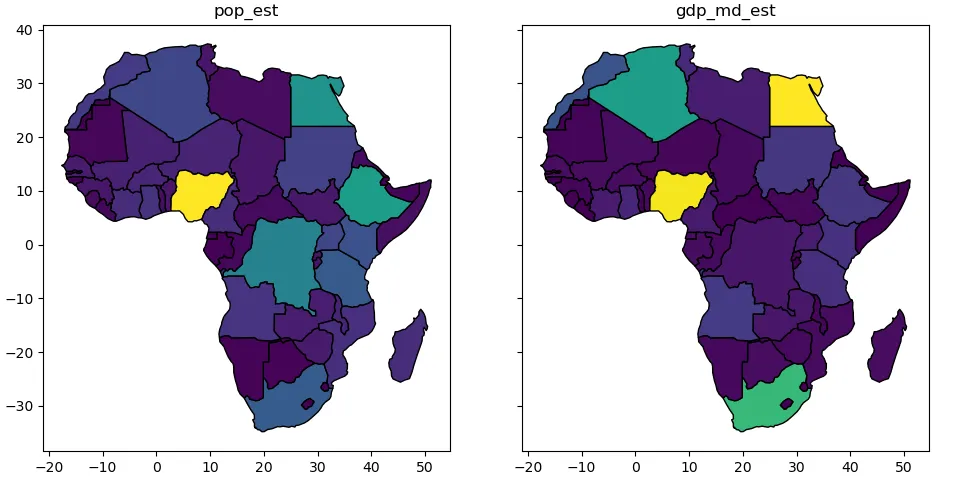
我不能直接应用马丁的解决方案。

