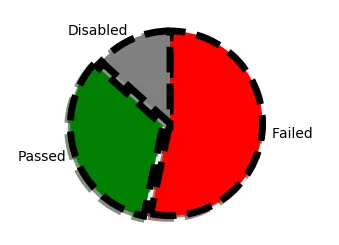
在Matplotlib中制作饼图时遇到了一些问题。目前它可以正确地绘制图表本身,但是楔形图有一个小问题。当我在参数中设置wedgeprops(例如linewidth,与linestyle相同)时,它会将阴影更改为阴影,而不是楔形本身。
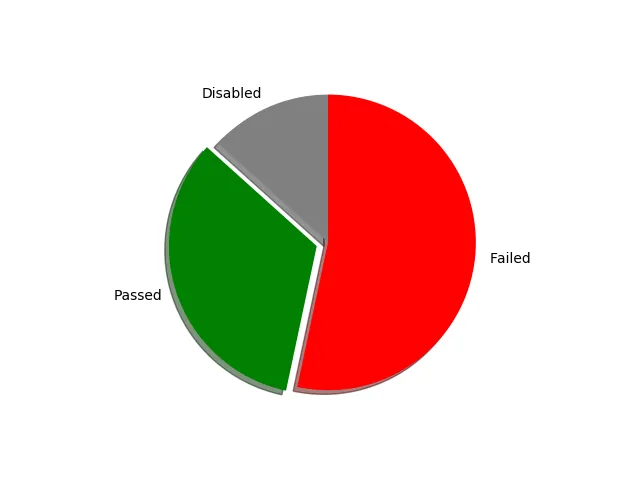
如何为楔形图正确绘制边框,而非阴影? 这就是它现在的外观。
import matplotlib.pyplot as plt

pie_chart_labels = ('Failed', 'Passed', 'Disabled')
pie_chart_colors = ('red', 'green', 'grey')
pie_chart_exploded = (0, 0.08, 0)
pie_chart_fig, pie_chart_ax = plt.subplots()
pie_chart_ax.margins(0.05)
pie_chart_ax.axis('equal')
pie_chart_test_results = (8, 5, 2)

pie_chart_ax.pie(pie_chart_test_results,
                 explode=pie_chart_exploded,
                 labels=pie_chart_labels,
                 colors=pie_chart_colors,
                 shadow=True,
                 counterclock=False,
                 startangle=90,
                 wedgeprops={'linewidth': 1, 'linestyle': 'solid', 'antialiased': True})

pie_chart_fig.savefig('PieChart.png')
matplotlib 边框用于阴影效果: