能否在 ggplot 的 x 轴上修改 NA 的位置?我已将 NA 设置为因子水平的第二个位置,但是 NA 仍然显示在 x 轴的最后一个位置。
library(ggplot2)
dat <- iris[c(1,2,51,52,101,102),]
dat[1,"Species"] <- NA
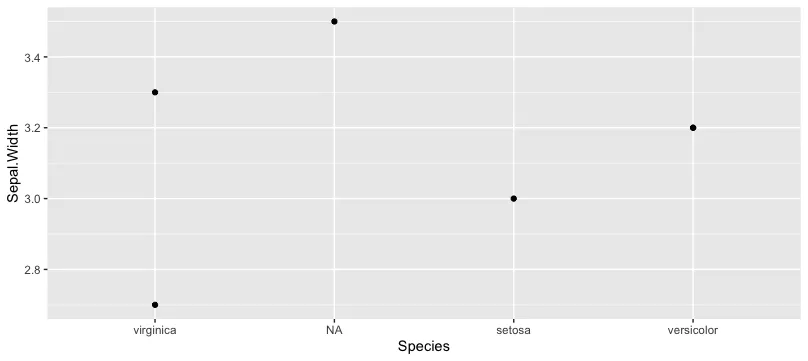
dat[["Species"]] <- factor(dat[["Species"]],
levels = c("virginica", NA, "setosa", "versicolor"),
exclude = NULL)
dat[["Species"]]
# [1] <NA> setosa versicolor versicolor virginica virginica
# Levels: virginica <NA> setosa versicolor
# NA is the second level
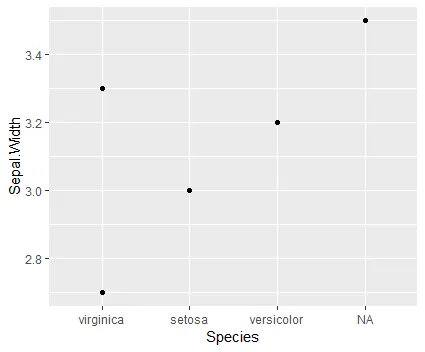
ggplot(dat, aes(x=Species, y=Sepal.Width)) + geom_point()
# NA appears at right
NA更改为"No Data",然后绘制图表? - zx8754