我希望能够将y轴和x轴的位置设为0,即使数据中存在负数。我在Google小组中读到说当时使用ggplot不可能实现这种功能。那么这个功能是否已经被实现了呢?
例如,当我的数据如下:
library(ggplot2)

df1 <- data.frame(
  S = rep(c(10, 5, 3.3, 2.5, 1.66, 0.62), 2),
  v = c(c(0.202, 0.079, 0.0597, 0.0565, 0.0365, 0.0318),
        c(0.25, 0.14, 0.07, 0.06, 0.04, 0.03)),
  inhibitor = rep(c("nein", "ja"), each = 6)
)
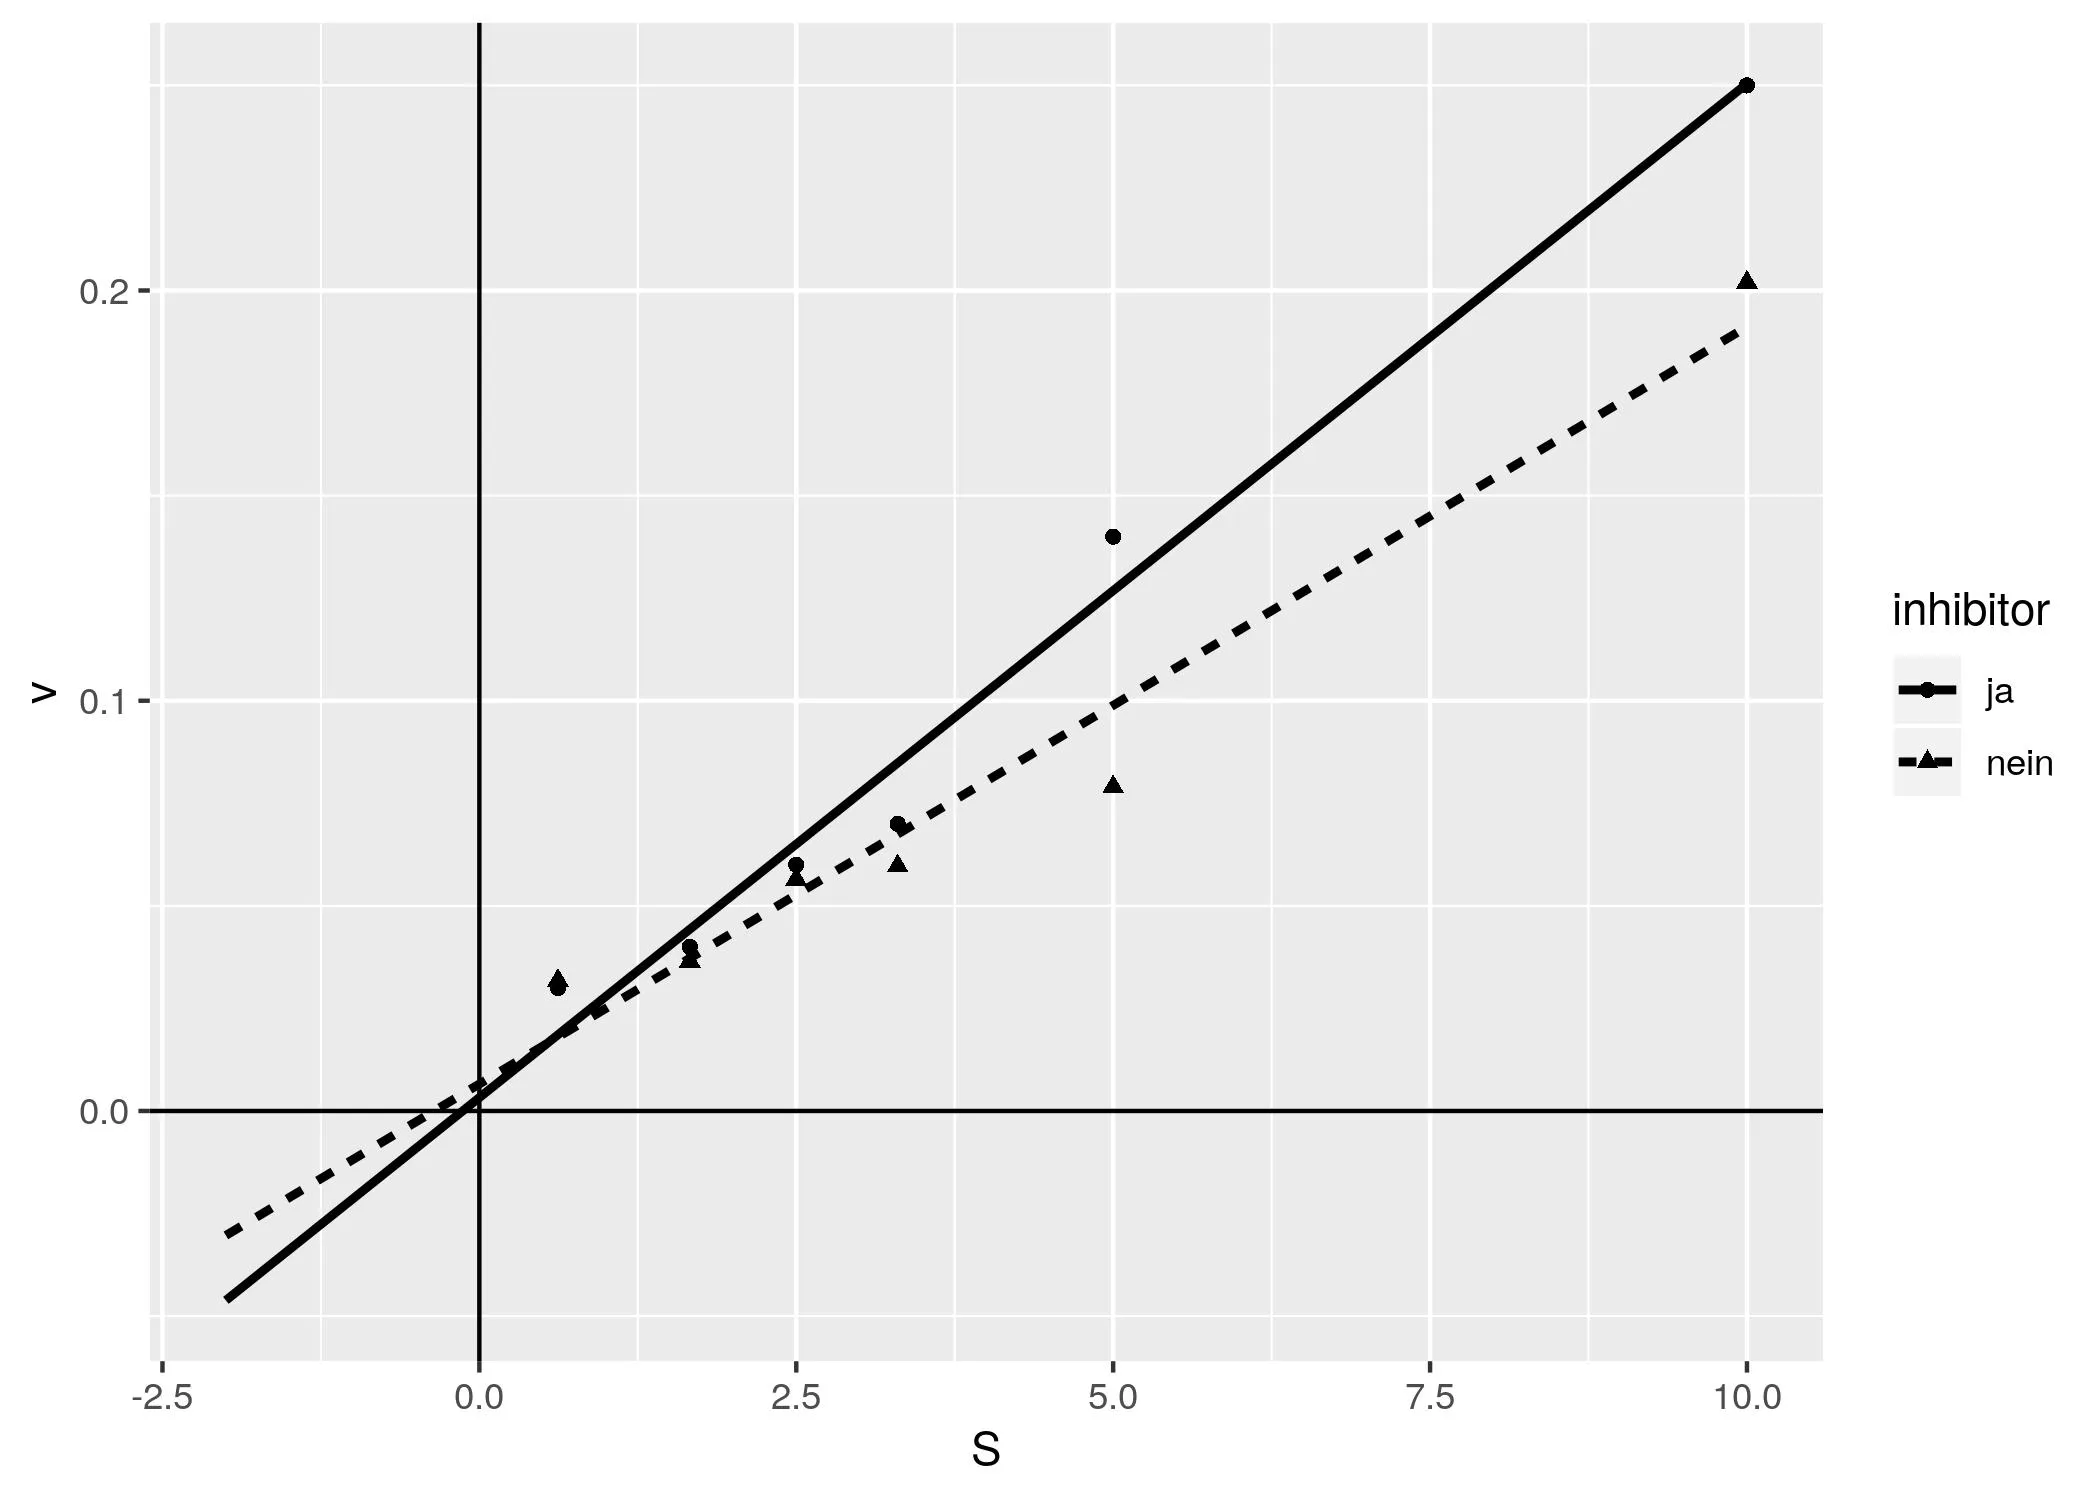
我希望根据我手动添加的
hline和vline来改变轴的位置。ggplot(df1, aes(y = v, x = S, shape = inhibitor)) +
geom_point() +
xlim(c(-2, 10)) +
geom_smooth(aes(linetype = inhibitor),
method = "lm", se = FALSE,
fullrange = TRUE, color = "black") +
geom_vline(xintercept = 0) +
geom_hline(yintercept = 0)
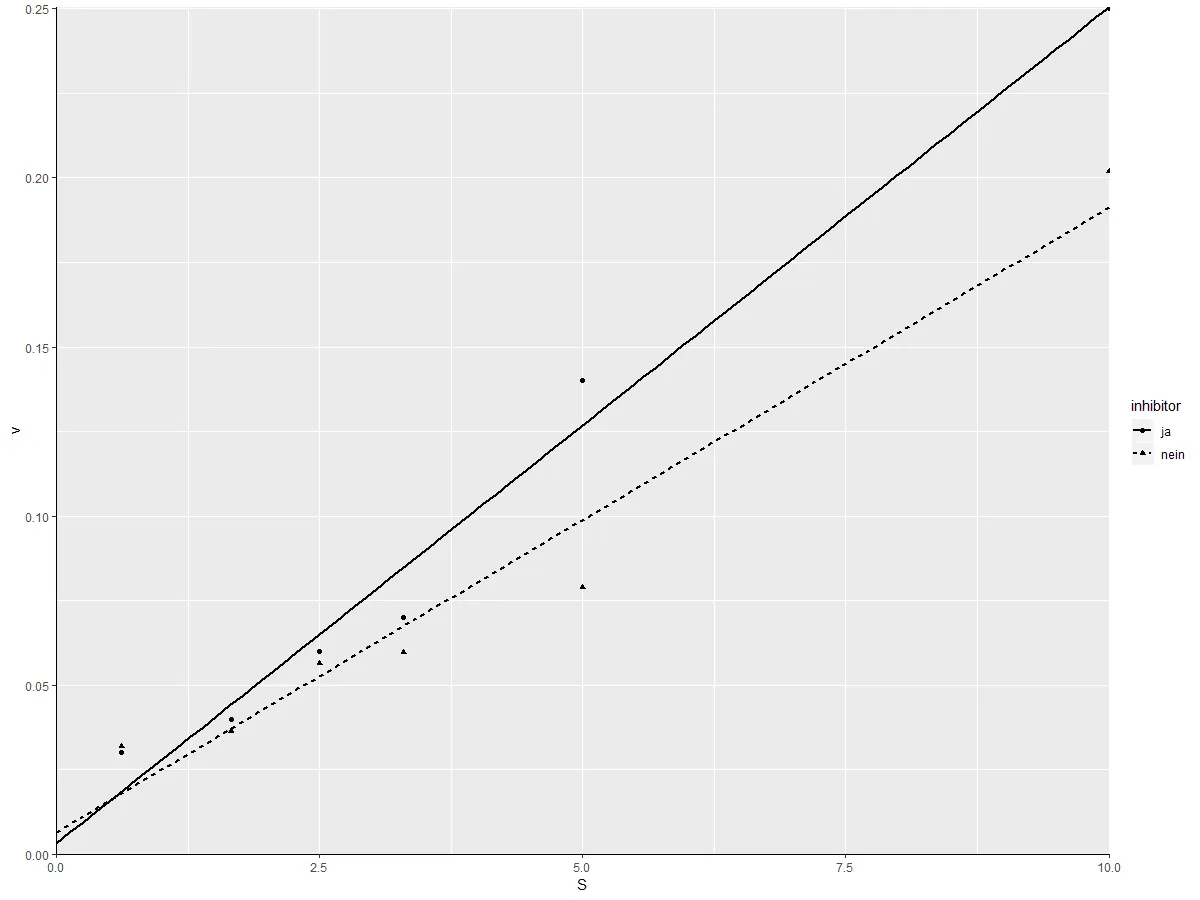
+ coord_cartesian(xlim = c(0, 10), ylim = c(0, 0.25))吗?这将放大你的绘图。请参考 https://www.rstudio.com/wp-content/uploads/2015/03/ggplot2-cheatsheet.pdf 的第二页,右下角。 - markushline和vline成为坐标轴的线条(包括刻度线和其他所有内容)。 - j3ypi