ggplot和grid:在ggplot grob中找到一个点的相对x和y位置

7

我正在使用网格视口合并ggplot的多个绘图,这是必要的(我认为),因为我想旋转一个绘图,这在标准的ggplot甚至gridExtra包中都不可能。

我想在两个绘图上画一条线,以使相关性更加清晰。但是要精确知道线的位置,我需要在ggplot绘图(grob?)中找到一个点的相对位置。

我已经做了以下示例:

require(reshape2)
require(grid)
require(ggplot2)


datamat <- matrix(rnorm(50), ncol=5)
cov_mat <- cov(datamat)
cov_mat[lower.tri(cov_mat)] <- NA

data_df <- melt(datamat)
cov_df <- melt(cov_mat)

plot_1 <- ggplot(data_df, aes(x=as.factor(Var2), y=value)) + geom_boxplot()
plot_2 <- ggplot(cov_df, aes(x=Var1, y=Var2, fill=value)) + 
                    geom_tile() +
                    scale_fill_gradient(na.value="transparent") + 
                    coord_fixed() +
                    theme(
                    legend.position="none",
                    plot.background = element_rect(fill = "transparent",colour = NA),
                    panel.grid=element_blank(),
                    panel.background=element_blank(),
                    panel.border = element_blank(),
                    plot.margin = unit(c(0, 0, 0, 0), "npc"),
                    axis.ticks=element_blank(), 
                    axis.title=element_blank(), 
                    axis.text=element_text(size=unit(0,"npc")),
                    )

cov_heatmap <- ggplotGrob(plot_2)
boxplot <- ggplotGrob(plot_1)

grid.newpage()

pushViewport(viewport(height=unit(sqrt(2* 0.4 ^2), 'npc'),
                      width=unit(sqrt(2* 0.4 ^2), 'npc'),
                      x=unit(0.5, 'npc'),
                      y=unit(0.63, 'npc'),
                      angle=-45,
                      clip="on")
            )
grid.draw(cov_heatmap)
upViewport(0)
pushViewport(viewport(height=unit(0.5, 'npc'),
                      width=unit(1, 'npc'),
                      x=unit(0.5, 'npc'),
                      y=unit(0.25, 'npc'),
                      clip="on")
            )
grid.draw(boxplot)

该代码生成了一个图表 enter image description here

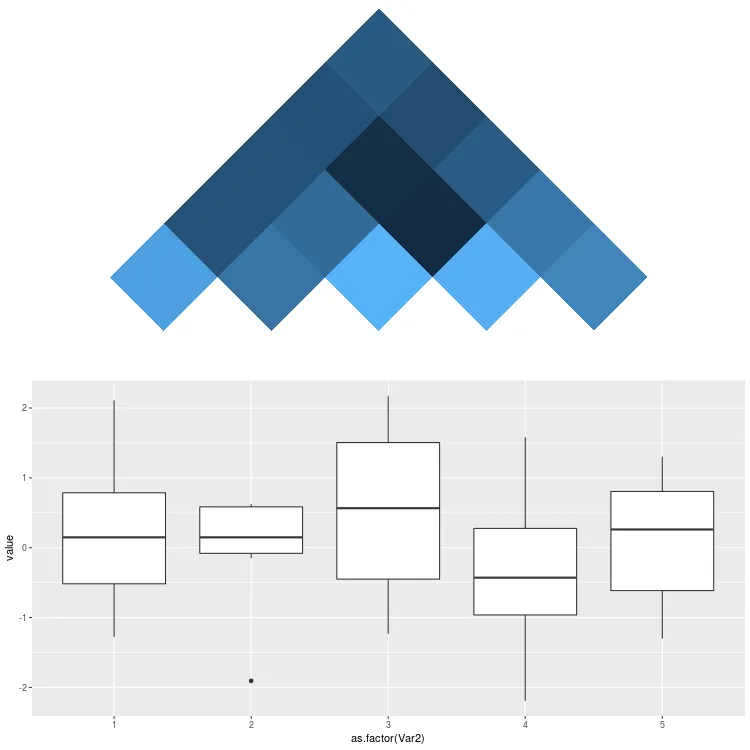
我如何找到箱线图中相对于x和y轴的位置(比如,第一个箱子的位置)以及三角协方差矩阵的相对位置。

我知道我必须查看boxplot的grob对象,但不知道如何在其中找到相关数据。
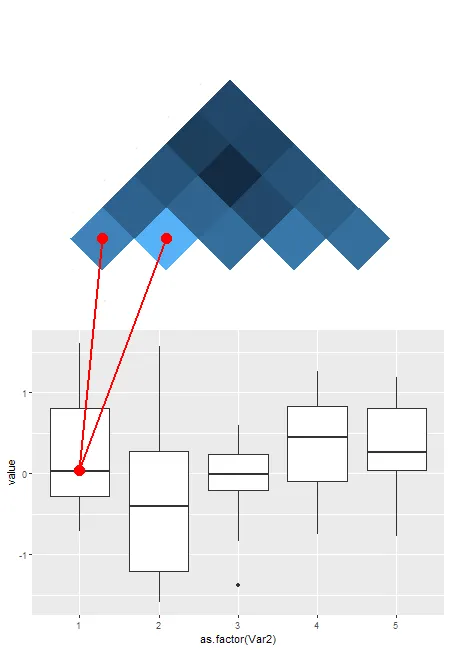
编辑:

要求我提供一个带有手动添加的线条的示例图,如下所示:enter image description here

这些线条来自底部图形上的点到顶部图形中的块。


这些事情确实很难做到(除非像@baptiste这样的魔术师出现)。你可能会发现,使用geom_polygon先旋转顶部面板的绘图更容易,然后再用例如cowplot::plot_grid对齐绘图。 - Axeman
谢谢,我会看看的。但是当然,如果我能解决这个问题,我更喜欢,因为这可能会帮助我和其他人在未来。 - onGiantShoulders
两个图之间的一条线?您能手动绘制这条线,以演示您确切需要它的位置吗? - naco
1
@naco,请查看我编辑过的帖子。 - onGiantShoulders
1个回答

8
这是一个老问题,所以答案可能不再相关,但无论如何....这不是一件简单的事情,但可以使用grid编辑工具来完成。需要沿途收集信息,这使得解决方案变得棘手。这是非常特殊的解决方案。很多东西取决于两个ggplots的具体情况。但也许有足够的内容供某人使用。关于要绘制的线条没有足够的信息;我将画出两条红线:一条从第一个箱形图的十字杆中心到热图左下角瓷砖的中心;另一条从第一个箱形图的十字杆中心到热图中的下一个瓷砖的中心。一些要点:
  1. 必须在不同的视口之间绘制线条。通常,grobs在视口内绘制,但有几种方法可以在视口之间获取线条。我将使用grid函数grid.move.to()和grid.line.to()。
  2. 可以通过grob的结构找到grob的坐标。也就是说,可以提取第一个箱形图,并查看其结构。该结构将给出须的段的位置,十字杆的段以及盒子的多边形的位置。
  3. 同样,可以提取热图,结构将给出热图中每个矩形(即每个瓷砖)的左上角坐标以及每个矩形的宽度和高度。一些简单的算术运算将给出瓷砖中心的坐标。
  4. 但是,矩形的坐标是以未旋转的视口为基础的。在选择相关矩形时需要小心。
# Draw the plot
require(reshape2)
require(grid)
require(ggplot2)

set.seed(4321) 
datamat <- matrix(rnorm(50), ncol=5)
cov_mat <- cov(datamat)
cov_mat[lower.tri(cov_mat)] <- NA

data_df <- melt(datamat)
cov_df <- melt(cov_mat)

plot_1 <- ggplot(data_df, aes(x=as.factor(Var2), y=value)) + geom_boxplot()
plot_2 <- ggplot(cov_df, aes(x=Var1, y=Var2, fill=value)) + 
                    geom_tile() +
                    scale_fill_gradient(na.value="transparent") + 
                    coord_fixed() +
                    theme(
                    legend.position="none",
                    plot.background = element_rect(fill = "transparent",colour = NA),
                    panel.grid=element_blank(),
                    panel.background=element_blank(),
                    panel.border = element_blank(),
                    plot.margin = unit(c(0, 0, 0, 0), "npc"),
                    axis.ticks=element_blank(), 
                    axis.title=element_blank(), 
                    axis.text=element_text(size=unit(0,"npc")))

cov_heatmap <- ggplotGrob(plot_2)
boxplot <- ggplotGrob(plot_1)

grid.newpage()

pushViewport(viewport(height=unit(sqrt(2* 0.4 ^2), 'npc'),
                      width=unit(sqrt(2* 0.4 ^2), 'npc'),
                      x=unit(0.5, 'npc'),
                      y=unit(0.63, 'npc'),
                      angle=-45,
                      clip="on",
                      name = "heatmap"))
grid.draw(cov_heatmap)
upViewport(0)
pushViewport(viewport(height=unit(0.5, 'npc'),
                      width=unit(1, 'npc'),
                      x=unit(0.5, 'npc'),
                      y=unit(0.25, 'npc'),
                      clip="on",
                      name = "boxplot"))
grid.draw(boxplot)
upViewport(0)


# So that grid can see all the grobs
grid.force()

# Get the names of the grobs
grid.ls()

相关内容涉及面板部分。热力图grobs的名称为:geom_rect.rect.2
构成第一个箱线图的grobs的名称为(数字可能不同):
- geom_boxplot.gTree.40 - GRID.segments.34 - geom_crossbar.gTree.39 - geom_polygon.polygon.37 - GRID.segments.38
要获取热力图中矩形的坐标。
names = grid.ls()$name
HMmatch = grep("geom_rect", names, value = TRUE)
hm = grid.get(HMmatch)

str(hm)
hm$x
hm$y
hm$width # heights are equal to the widths
hm$gp$fill

(请注意, just 设置为“left”,“top”)热力图是一个5x5的矩形网格,但只有上半部分被着色,因此在图中可见。所选两个矩形的坐标是:(0.045、0.227)和(0.227、0.409),每个矩形的宽度和高度均为0.182。
要获取第一个箱线图中相关点的坐标。
BPmatch = grep("geom_boxplot.gTree", names, value = TRUE)[-1]
box1 = grid.gget(BPmatch[1])
str(box1)

鬃毛的x坐标为0.115,横杠的y坐标为0.507。

现在,要在两个视口之间画线。这些线是在面板视口中“绘制”的,但热图面板视口的名称与箱线图面板视口的名称相同。为了克服这个困难,我寻找箱线图视口,然后向下推到其面板视口;同样地,我寻找热图视口,然后向下推到其面板视口。

## First Line (and points)
seekViewport("boxplot") 
downViewport("panel.7-5-7-5")
grid.move.to(x = .115, y = .503, default.units = "native")
grid.points(x = .115, y = .503, default.units = "native", 
      size = unit(5, "mm"), pch = 16, gp=gpar(col = "red"))


seekViewport("heatmap") 
downViewport("panel.7-5-7-5")
grid.line.to(x = 0.045 + .5*.182, y = 0.227 - .5*.182, default.units = "native", gp = gpar(col = "red", lwd = 2))
grid.points(x = 0.045 + .5*.182, y = 0.227 - .5*.182, default.units = "native", 
      size = unit(5, "mm"), pch = 16, gp=gpar(col = "red"))


## Second line (and points)
seekViewport("boxplot") 
downViewport("panel.7-5-7-5")
grid.move.to(x = .115, y = .503, default.units = "native")


seekViewport("heatmap") 
downViewport("panel.7-5-7-5")
grid.line.to(x = 0.227 + .5*.182, y = 0.409 - .5*.182, default.units = "native", gp = gpar(col = "red", lwd = 2))
grid.points(x = 0.227 + .5*.182, y = 0.409 - .5*.182, default.units = "native", 
      size = unit(5, "mm"), pch = 16, gp=gpar(col = "red"))

希望您能喜欢。

输入图片描述


1
漂亮的回答。谢谢! - Tung

网页内容由stack overflow 提供, 点击上面的
可以查看英文原文,
原文链接