ggbiplot - 如何在绘图中不使用特征向量

3

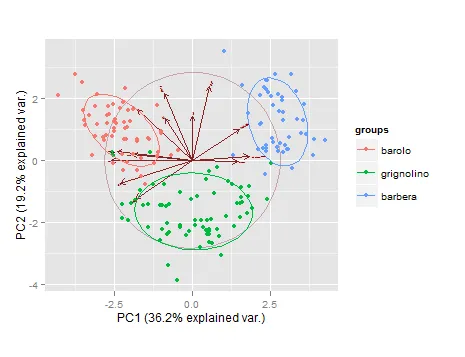
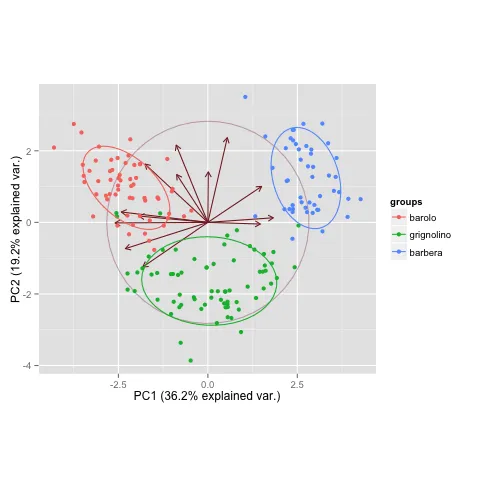
我有一个数据集data$cell_line.sva,其维度为313x11875。

cc.pca <- prcomp(data$cell_line.sva, center = TRUE, scale. = TRUE, retx = TRUE) 
g <- ggbiplot(cc.pca, obs.scale = 1, var.scale = 1, groups = as.factor(cgpResponse), ellipse = TRUE, circle = FALSE)
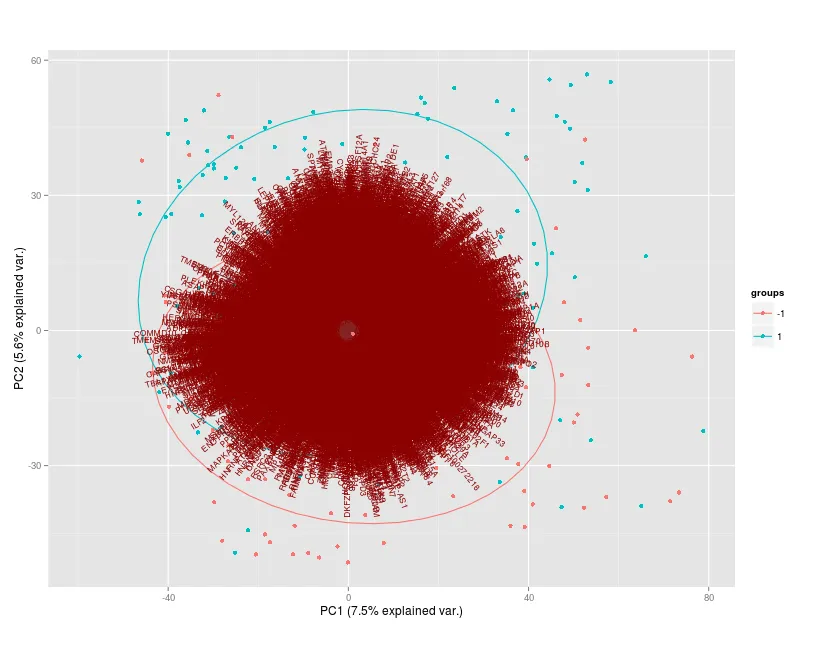
enter image description here

如何去掉特征名称?(红色文本)

4个回答

6

我还没有足够的声望点数,因此无法评论,但是通过将var.axes设置为false,可以很容易地去除箭头和名称:

ggbiplot(wine.pca, obs.scale = 1, var.scale = 1, 
         groups = wine.class, ellipse = TRUE, 
         circle = TRUE, var.axes=FALSE)

5
你需要使用varname.size参数来实现这一点。
使用文档中的示例:
data(wine)
wine.pca <- prcomp(wine, scale. = TRUE)
print(ggbiplot(wine.pca, obs.scale = 1, var.scale = 1, 
               groups = wine.class, ellipse = TRUE, circle = TRUE))

然后添加varname.size参数:

print(ggbiplot(wine.pca, obs.scale = 1, var.scale = 1, 
               groups = wine.class, ellipse = TRUE, circle = TRUE,
               varname.size=0)) #set it to zero

这里输入图像描述

现在,你拥有了想要的东西!


1
有没有办法也删除箭头? - Stefan

4

我无法确定这样做是否会产生有用的结果,但还是试一试。根据我的代码和帮助页面阅读,函数不允许您通过参数设置来禁止名称显示。所以看看代码,似乎因子的标签是从prcomp对象的$rotations元素中提取的。尝试将这些名称全部设置为空字符会导致错误,所以我通过设置不同长度的空格值来成功地解决了问题。

data(wine)    # need a reproducible example so use the help page 
 wine.pca <- prcomp(wine, scale. = TRUE)
print(ggbiplot(wine.pca, obs.scale = 1, var.scale = 1, groups = wine.class, ellipse = TRUE, circle = TRUE))
# that was the equivalent of your plot
# Now change the input value

dimnames(wine.pca$rotation)[[1]] <- 
   Reduce(function(x,y) paste0(x,y),    # function to concatentate the lanks
          rep(" ",dim(wine.pca$rotation)[1]),   # corrrect number of blanks
           acc=TRUE)                    # save all intermediate strings
 print(ggbiplot(wine.pca, obs.scale = 1, var.scale = 1, groups = wine.class, 
        ellipse = TRUE, circle = TRUE))
 #Look, Ma! No labels

enter image description here


我可以这样解释图表吗:AlcoholMalicAcid占三个组之间变化的36.2%和19.2%? - Little Bee
说实话,我完全不知道。在这种情况下,我只是在乱改代码以满足所需的修改,对于底层的统计解释一无所知。 - IRTFM
有没有办法也去掉箭头? - Stefan
听起来像是另一个问题。 - IRTFM

0

好的,所以我用一种非常粗暴的方式来完成这个任务。

    print(ggbiplot(wine.pca, obs.scale = 1, var.scale = 1,
           groups = wine.class, ellipse = TRUE, circle = TRUE,
           varname.size=0, varname.adjust = 20))

它只是简单地设置变量名称的偏移量,超出了绘图限制。


网页内容由stack overflow 提供, 点击上面的
可以查看英文原文,
原文链接