是的,我们可以设计一个新的几何图形来使用ggbiplot。这里有一个新的几何图形,可以生成凸包:
library(ggplot2)
StatBag <- ggproto("Statbag", Stat,
compute_group = function(data, scales, prop = 0.5) {
plothulls_ <- function(x, y, fraction, n.hull = 1,
col.hull, lty.hull, lwd.hull, density=0, ...){
if(ncol(x) == 2){ y <- x[,2]; x <- x[,1] }
n <- length(x)
if(!missing(fraction)) {
n.hull <- 1
if(missing(col.hull)) col.hull <- 1
if(missing(lty.hull)) lty.hull <- 1
if(missing(lwd.hull)) lwd.hull <- 1
x.old <- x; y.old <- y
idx <- chull(x,y); x.hull <- x[idx]; y.hull <- y[idx]
for( i in 1:(length(x)/3)){
x <- x[-idx]; y <- y[-idx]
if( (length(x)/n) < fraction ){
return(cbind(x.hull,y.hull))
}
idx <- chull(x,y); x.hull <- x[idx]; y.hull <- y[idx];
}
}
if(missing(col.hull)) col.hull <- 1:n.hull
if(length(col.hull)) col.hull <- rep(col.hull,n.hull)
if(missing(lty.hull)) lty.hull <- 1:n.hull
if(length(lty.hull)) lty.hull <- rep(lty.hull,n.hull)
if(missing(lwd.hull)) lwd.hull <- 1
if(length(lwd.hull)) lwd.hull <- rep(lwd.hull,n.hull)
result <- NULL
for( i in 1:n.hull){
idx <- chull(x,y); x.hull <- x[idx]; y.hull <- y[idx]
result <- c(result, list( cbind(x.hull,y.hull) ))
x <- x[-idx]; y <- y[-idx]
if(0 == length(x)) return(result)
}
result
}
the_matrix <- matrix(data = c(data$x, data$y), ncol = 2)
setNames(data.frame(plothulls_(the_matrix, fraction = prop)), nm = c("x", "y"))
},
required_aes = c("x", "y")
)
stat_bag <- function(mapping = NULL, data = NULL, geom = "polygon",
position = "identity", na.rm = FALSE, show.legend = NA,
inherit.aes = TRUE, prop = 0.5, alpha = 0.3, ...) {
layer(
stat = StatBag, data = data, mapping = mapping, geom = geom,
position = position, show.legend = show.legend, inherit.aes = inherit.aes,
params = list(na.rm = na.rm, prop = prop, alpha = alpha, ...)
)
}
geom_bag <- function(mapping = NULL, data = NULL,
stat = "identity", position = "identity",
prop = 0.5,
alpha = 0.3,
...,
na.rm = FALSE,
show.legend = NA,
inherit.aes = TRUE) {
layer(
data = data,
mapping = mapping,
stat = StatBag,
geom = GeomBag,
position = position,
show.legend = show.legend,
inherit.aes = inherit.aes,
params = list(
na.rm = na.rm,
alpha = alpha,
prop = prop,
...
)
)
}
GeomBag <- ggproto("GeomBag", Geom,
draw_group = function(data, panel_scales, coord) {
n <- nrow(data)
if (n == 1) return(zeroGrob())
munched <- coord_munch(coord, data, panel_scales)
munched <- munched[order(munched$group), ]
first_idx <- !duplicated(munched$group)
first_rows <- munched[first_idx, ]
ggplot2:::ggname("geom_bag",
grid:::polygonGrob(munched$x, munched$y, default.units = "native",
id = munched$group,
gp = grid::gpar(
col = first_rows$colour,
fill = alpha(first_rows$fill, first_rows$alpha),
lwd = first_rows$size * .pt,
lty = first_rows$linetype
)
)
)
},
default_aes = aes(colour = "NA", fill = "grey20", size = 0.5, linetype = 1,
alpha = NA, prop = 0.5),
handle_na = function(data, params) {
data
},
required_aes = c("x", "y"),
draw_key = draw_key_polygon
)
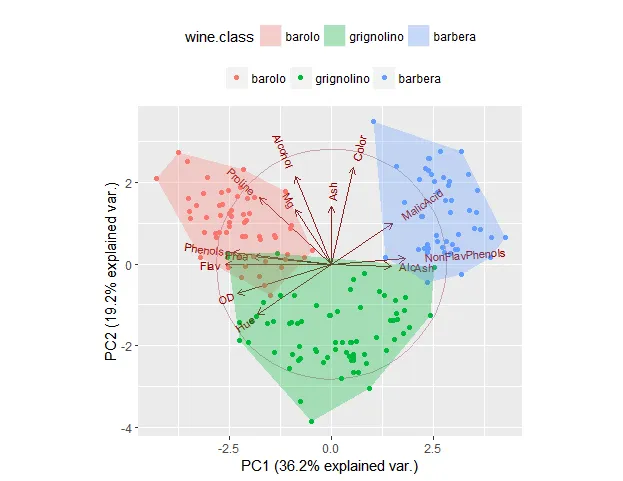
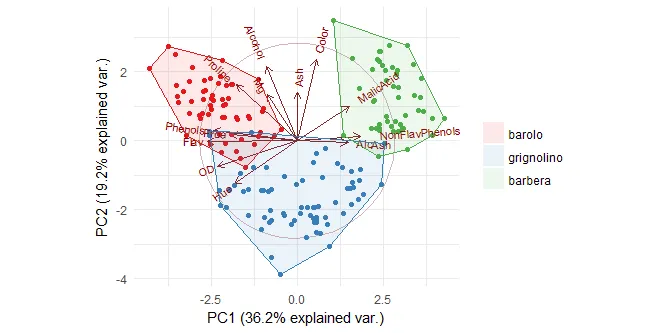
以下是与 ggbiplot 一起使用的示例,我们将 prop 设置为 1,以表示我们要绘制一个多边形来包围所有点:
library(ggbiplot)
data(wine)
wine.pca <- prcomp(wine, scale. = TRUE)
g <- ggbiplot(wine.pca, obs.scale = 1, var.scale = 1,
              groups = wine.class, ellipse = FALSE, circle = TRUE)
g <- g + scale_color_discrete(name = '')
g <- g + theme(legend.direction = 'horizontal', legend.position = 'top')
g + geom_bag(aes(group = wine.class, fill = wine.class), prop = 1)