我在这里找到了一个使用ggplot和ddply绘制凸包形状的好例子: Drawing outlines around multiple geom_point groups with ggplot
我想尝试类似的东西——创建类似于Ashby Diagram的图表——来练习使用data.table包:
test<-function()
{
library(data.table)
library(ggplot2)

set.seed(1)
这里我定义了一个简单的表格:
dt<-data.table(xdata=runif(15),ydata=runif(15),level=rep(c("a","b","c"),each=5),key="level")
然后我按照层级定义船体位置:
hulls<-dt[,as.integer(chull(.SD)),by=level]
setnames(hulls,"V1","hcol")
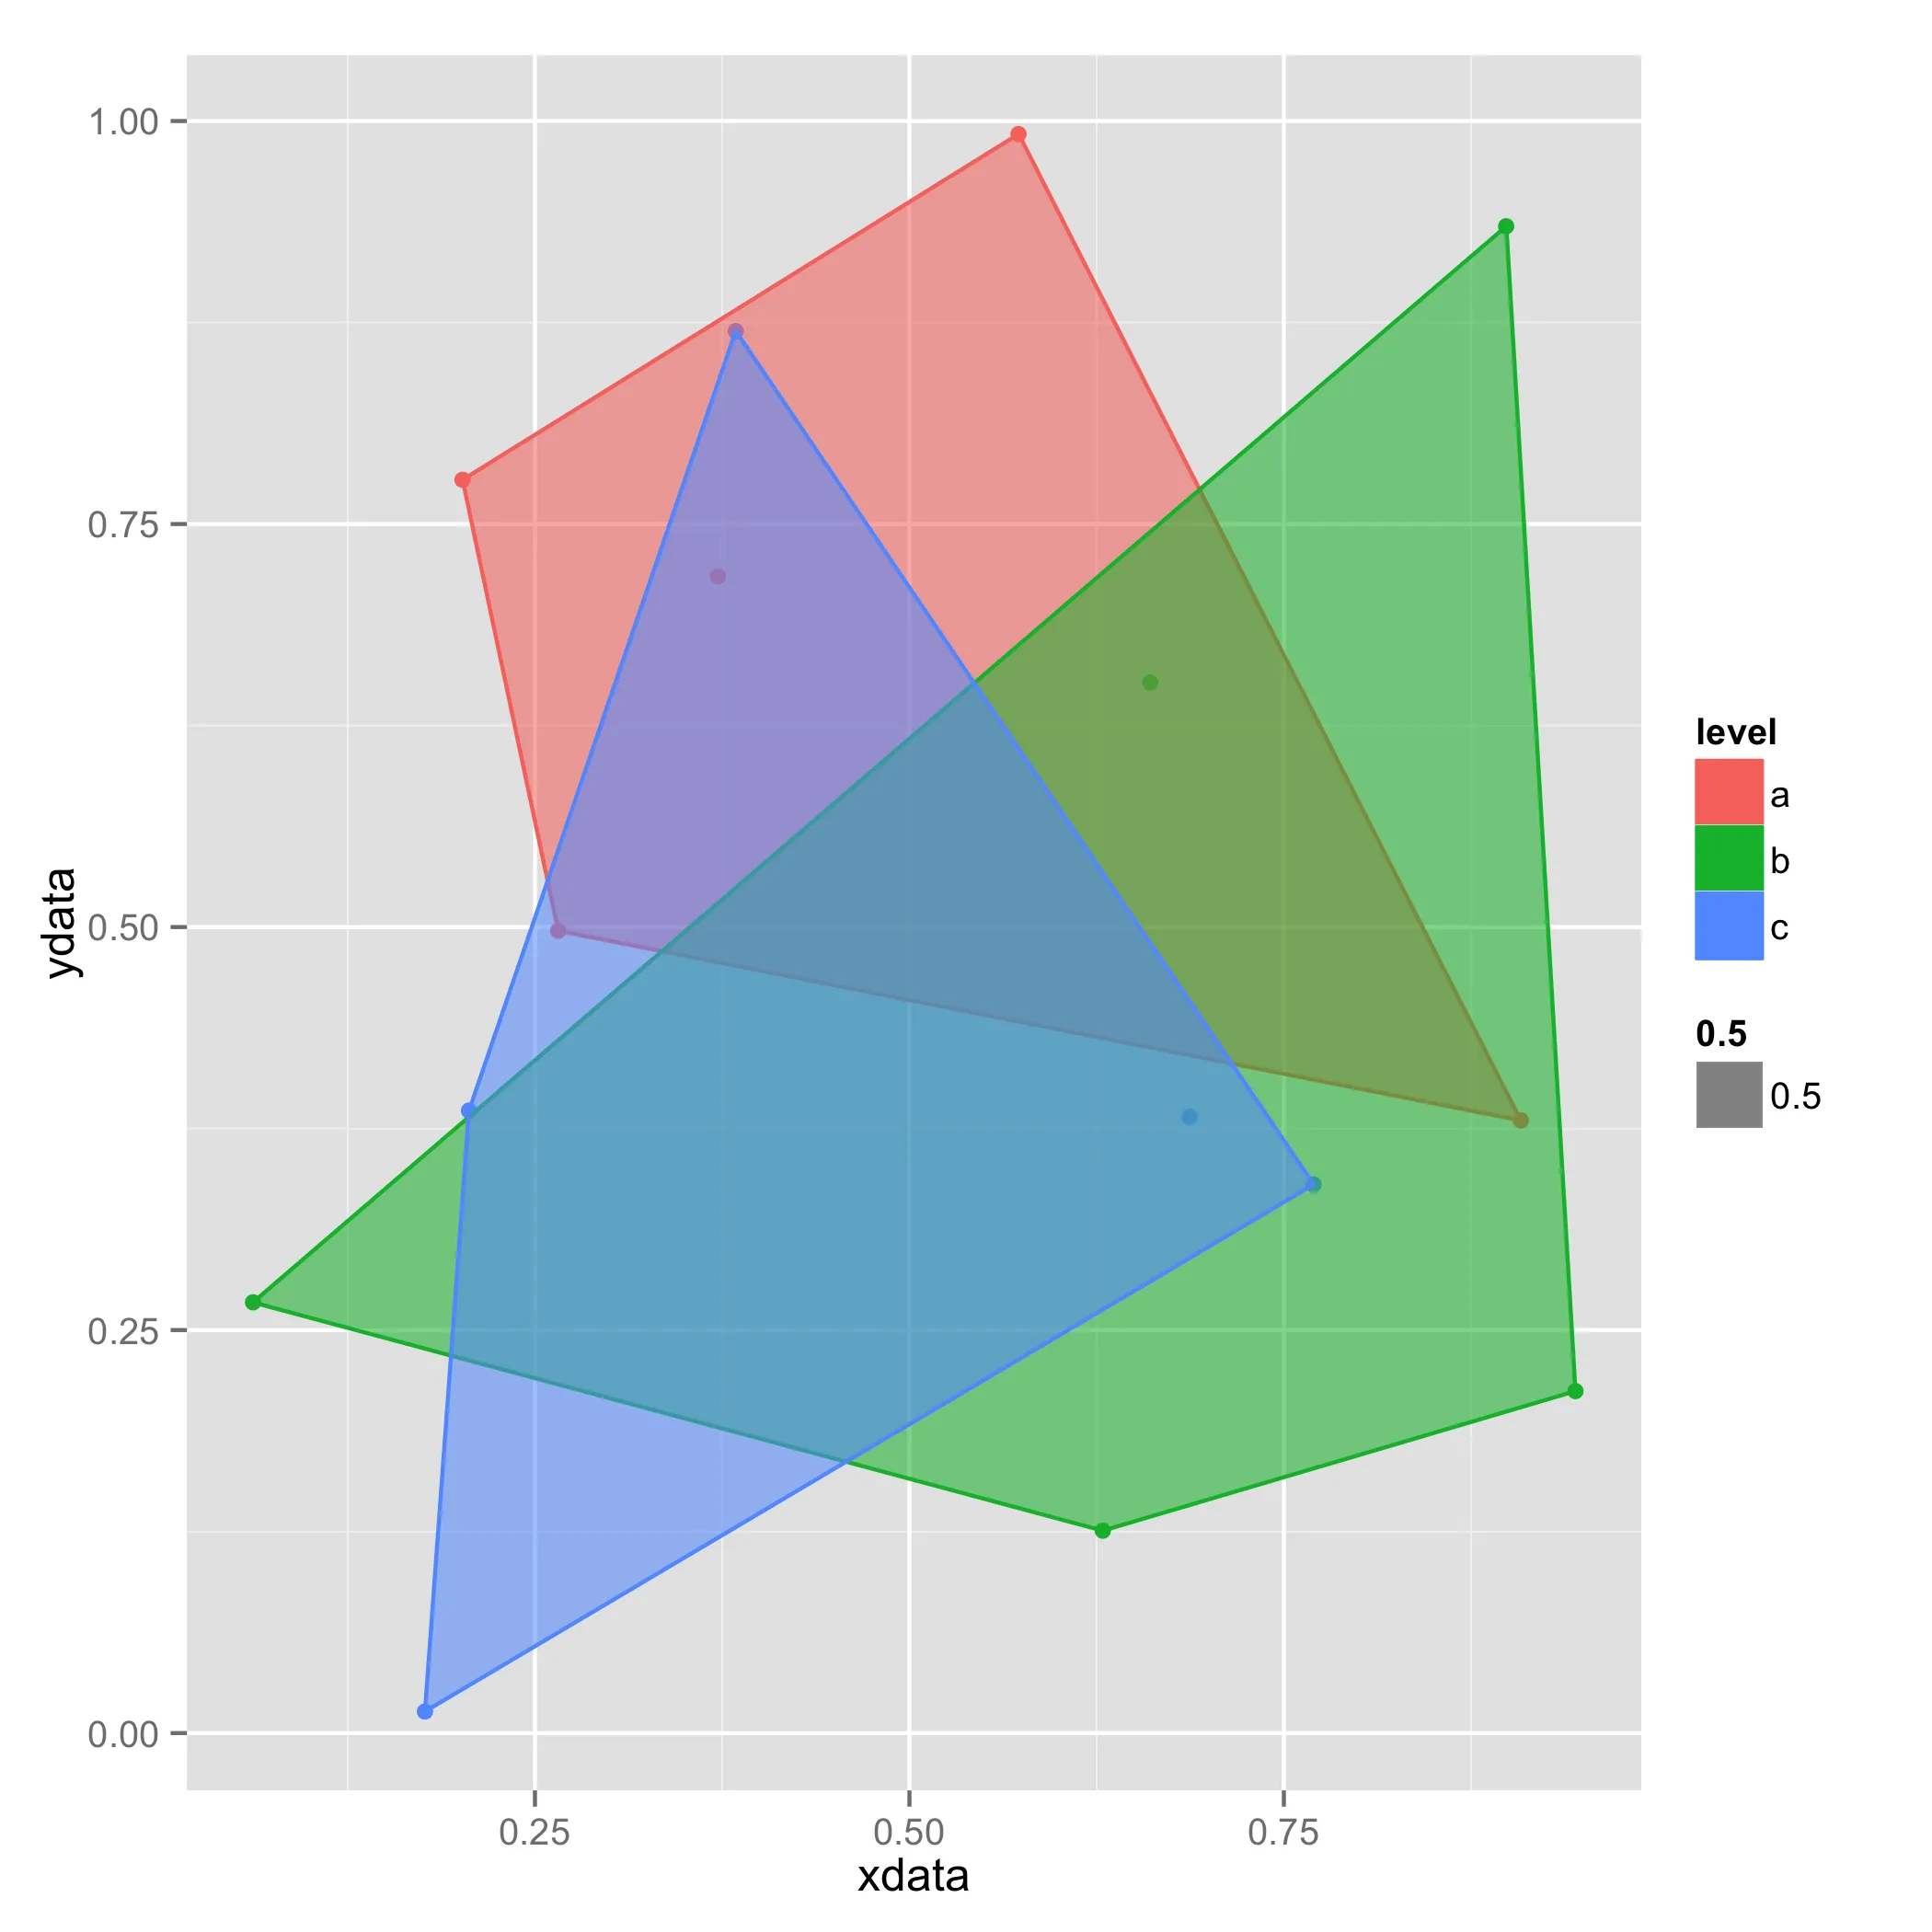
那么我的想法是将船体与 dt 合并,以便最终可以操纵船体,使其达到 ggplot 正确的形式(如下所示):
ashby<-ggplot(dt,aes(x=xdata,y=ydata,color=level))+
        geom_point()+
        geom_line()+
        geom_polygon(data=hulls,aes(fill=level))
}
但是无论我尝试如何合并hulls和dt,都会出现错误。例如,merge(hulls,dt)会产生如脚注1所示的错误。
这似乎应该很简单,我相信我只是漏掉了一些显而易见的东西。非常感谢任何指向类似帖子的方向或关于如何为ggplot准备hull的想法。或者如果您认为坚持ddply方法最好,请让我知道。
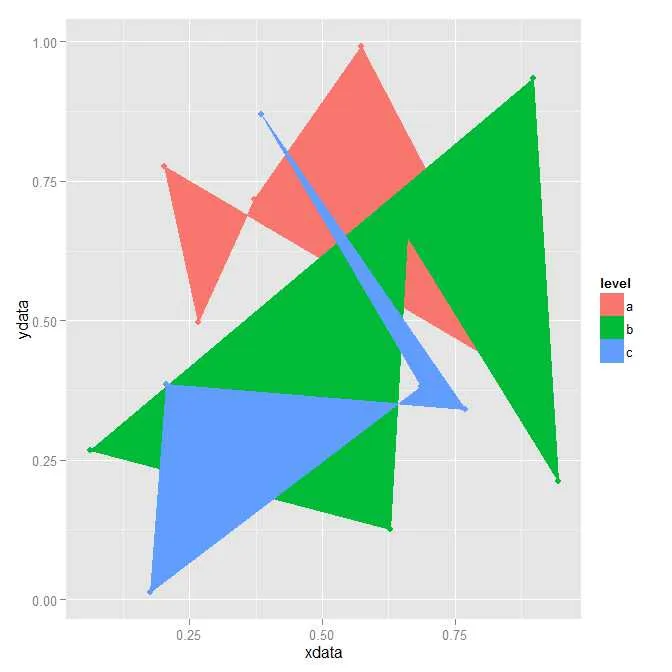
不希望出现的输出示例:
test<-function(){
    library(data.table)
    library(ggplot2)
    dt<-data.table(xdata=runif(15),ydata=runif(15),level=rep(c("a","b","c"),each=5),key="level")
    set.seed(1)
    hulls<-dt[,as.integer(chull(.SD)),by=level]
    setnames(hulls,"V1","hcol")
    setkey(dt, 'level') #setting the key seems unneeded
    setkey(hulls, 'level')
    hulls<-hulls[dt, allow.cartesian = TRUE]
    ggplot(dt,aes(x=xdata,y=ydata,color=level))+
            geom_point()+
            geom_polygon(data=hulls,aes(fill=level))
}
 脚注1:
脚注1:
Error in vecseq(f__, len__, if (allow.cartesian) NULL else as.integer(max(nrow(x), : Join results in 60 rows; more than 15 = max(nrow(x),nrow(i)). Check for duplicate key values in i, each of which join to the same group in x over and over again. If that's ok, try including
jand droppingby(by-without-by) so that j runs for each group to avoid the large allocation. If you are sure you wish to proceed, rerun with allow.cartesian=TRUE. Otherwise, please search for this error message in the FAQ, Wiki, Stack Overflow and datatable-help for advice.
library可能是不必要的(如果您计划多次调用该函数,则效率低下)。 - Victor K.