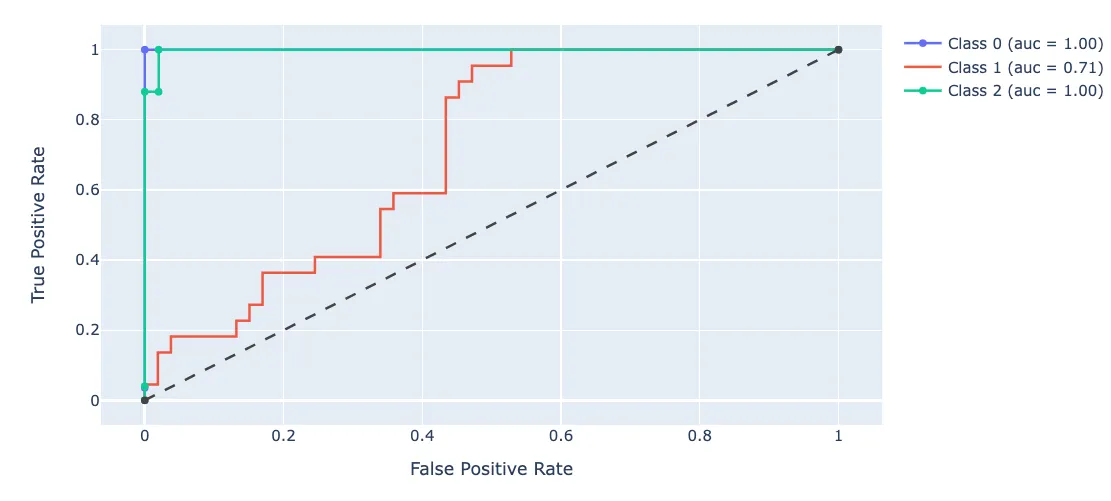
我正在尝试使用逻辑回归软件包在Python中开发的预测模型来绘制ROC曲线以评估模型的准确性。我已经计算出真正例率和假正例率,但是我无法弄清如何使用matplotlib正确绘制这些并计算AUC值。我该怎么做?
如何在Python中绘制ROC曲线
121
- user3847447
18个回答
4
我为 ROC 曲线编写了一个简单的函数,并将其包含在一个软件包中。我刚开始学习机器学习,如果这段代码有任何问题,请告诉我!更多细节请看 GitHub 自述文件 :)
https://github.com/bc123456/ROC
from sklearn.metrics import confusion_matrix, accuracy_score, roc_auc_score, roc_curve
import matplotlib.pyplot as plt
import seaborn as sns
import numpy as np

def plot_ROC(y_train_true, y_train_prob, y_test_true, y_test_prob):
    '''
    a funciton to plot the ROC curve for train labels and test labels.
    Use the best threshold found in train set to classify items in test set.
    '''
    fpr_train, tpr_train, thresholds_train = roc_curve(y_train_true, y_train_prob, pos_label =True)
    sum_sensitivity_specificity_train = tpr_train + (1-fpr_train)
    best_threshold_id_train = np.argmax(sum_sensitivity_specificity_train)
    best_threshold = thresholds_train[best_threshold_id_train]
    best_fpr_train = fpr_train[best_threshold_id_train]
    best_tpr_train = tpr_train[best_threshold_id_train]
    y_train = y_train_prob > best_threshold

    cm_train = confusion_matrix(y_train_true, y_train)
    acc_train = accuracy_score(y_train_true, y_train)
    auc_train = roc_auc_score(y_train_true, y_train)

    print 'Train Accuracy: %s ' %acc_train
    print 'Train AUC: %s ' %auc_train
    print 'Train Confusion Matrix:'
    print cm_train

    fig = plt.figure(figsize=(10,5))
    ax = fig.add_subplot(121)
    curve1 = ax.plot(fpr_train, tpr_train)
    curve2 = ax.plot([0, 1], [0, 1], color='navy', linestyle='--')
    dot = ax.plot(best_fpr_train, best_tpr_train, marker='o', color='black')
    ax.text(best_fpr_train, best_tpr_train, s = '(%.3f,%.3f)' %(best_fpr_train, best_tpr_train))
    plt.xlim([0.0, 1.0])
    plt.ylim([0.0, 1.0])
    plt.xlabel('False Positive Rate')
    plt.ylabel('True Positive Rate')
    plt.title('ROC curve (Train), AUC = %.4f'%auc_train)

    fpr_test, tpr_test, thresholds_test = roc_curve(y_test_true, y_test_prob, pos_label =True)

    y_test = y_test_prob > best_threshold

    cm_test = confusion_matrix(y_test_true, y_test)
    acc_test = accuracy_score(y_test_true, y_test)
    auc_test = roc_auc_score(y_test_true, y_test)

    print 'Test Accuracy: %s ' %acc_test
    print 'Test AUC: %s ' %auc_test
    print 'Test Confusion Matrix:'
    print cm_test

    tpr_score = float(cm_test[1][1])/(cm_test[1][1] + cm_test[1][0])
    fpr_score = float(cm_test[0][1])/(cm_test[0][0]+ cm_test[0][1])

    ax2 = fig.add_subplot(122)
    curve1 = ax2.plot(fpr_test, tpr_test)
    curve2 = ax2.plot([0, 1], [0, 1], color='navy', linestyle='--')
    dot = ax2.plot(fpr_score, tpr_score, marker='o', color='black')
    ax2.text(fpr_score, tpr_score, s = '(%.3f,%.3f)' %(fpr_score, tpr_score))
    plt.xlim([0.0, 1.0])
    plt.ylim([0.0, 1.0])
    plt.xlabel('False Positive Rate')
    plt.ylabel('True Positive Rate')
    plt.title('ROC curve (Test), AUC = %.4f'%auc_test)
    plt.savefig('ROC', dpi = 500)
    plt.show()

    return best_threshold
- Brian Chan
2
2
当您需要概率值时...以下代码可以一次性获取AUC值并将其绘制出来。
from sklearn.metrics import plot_roc_curve

plot_roc_curve(m,xs,y)
当你有了概率值时,你不能一次性获得auc值和绘图。请按照以下步骤进行:
from sklearn.metrics import roc_curve

fpr,tpr,_ = roc_curve(y,y_probas)
plt.plot(fpr,tpr, label='AUC = ' + str(round(roc_auc_score(y,m.oob_decision_function_[:,1]), 2)))
plt.legend(loc='lower right')
- agent18
1
在我的代码中,我有X_train和y_train,类别为0和1。对于每个数据点,clf.predict_proba()方法计算两个类别的概率。我将类别1的概率与不同阈值的值进行比较。
probability = clf.predict_proba(X_train)

def plot_roc(y_train, probability):
  threshold_values = np.linspace(0,1,100)       #Threshold values range from 0 to 1
  FPR_list = []
  TPR_list = []

  for threshold in threshold_values:            #For every value of threshold
    y_pred = []                                 #Classify every data point in the test set

#prob is an array consisting of 2 values - Probability of datapoint in Class0 and Class1.
    for prob in probability:
      if ((prob[1])<threshold):                 #Prob of class1 (positive class)
        y_pred.append(0)
        continue
      elif ((prob[1])>=threshold): y_pred.append(1)

#Plot Confusion Matrix and Obtain values of TP, FP, TN, FN
    c_m = confusion_matrix(y, y_pred)
    TN = c_m[0][0]
    FP = c_m[0][1]
    FN = c_m[1][0]
    TP = c_m[1][1]

    FPR = FP/(FP + TN)                          #Obtain False Positive Rate
    TPR = TP/(TP + FN)                          #Obtain True Positive Rate

    FPR_list.append(FPR)
    TPR_list.append(TPR)

  fig = plt.figure()
  plt.plot(FPR_list, TPR_list)
  plt.ylabel('TPR')
  plt.xlabel('FPR')
  plt.show()
- matak8s
0
由于ROC曲线仅适用于二元分类,因此请使用数据进行二值化和拉平处理
# Binarize data for getting AUC
y_test_bin = label_binarize(y_test, classes=range(y_train.min() , y_train.max()))
y_pred_bin = label_binarize(Predicted_result, classes=range(y_train.min() , y_train.max()))

# Calculate FP , TP rate
fpr, tpr, _ = roc_curve(y_test_bin.ravel(), y_pred_bin.ravel()  )

# Get AUC ,
auc = roc_auc_score(y_test_bin, y_pred_bin, average='micro', multi_class='ovr')

#create ROC curve
plt.plot(fpr,tpr , label= f"AUC = {auc}" , )
plt.ylabel('True Positive Rate')
plt.xlabel('False Positive Rate')
plt.xlim([0.0, 1.0])
plt.ylim([0.0, 1.0])
plt.title('ROC')
plt.legend(loc=7)
plt.figure(figsize = [])

plt.show()
- Omar Essam El-Din
0
如在w3Schools所述 这里:
import matplotlib.pyplot as plt

def plot_roc_curve(true_y, y_prob):
    """
    plots the roc curve based of the probabilities
    """

    fpr, tpr, thresholds = roc_curve(true_y, y_prob)
    plt.plot(fpr, tpr)
    plt.xlabel('False Positive Rate')
    plt.ylabel('True Positive Rate')

plot_roc_curve(y, y_proba)
print(f'model AUC score: {roc_auc_score(y, y_proba)}')
- ofir_aghai
0
另一种使用scikit和sklearn的解决方案
安装软件包:
使用这个解决方案,您可以控制图例,并且具有0.5的基准AUC。 Python代码:
更多信息: https://scikit-learn.org/stable/modules/generated/sklearn.metrics.RocCurveDisplay.html
安装软件包:
pip3 install scikit-plot
使用这个解决方案,您可以控制图例,并且具有0.5的基准AUC。 Python代码:
y_true = np.array([0, 0, 1, 1])
y_score = np.array([0.1, 0.4, 0.35, 0.8])


fpr, tpr, thresholds = metrics.roc_curve(y_true, y_score, pos_label=1)
auc = metrics.auc(fpr, tpr)
auc = format(auc, '.2f')

RocCurveDisplay.from_predictions(
    y_true,
    y_score,
    name="micro-average OvR",
    color="darkorange")

plt.plot(np.arange(0,1.1,0.1),np.arange(0,1.1,0.1),linestyle='-.',color='k')
plt.axis("square")
plt.xlabel("False Positive Rate")
plt.ylabel("True Positive Rate")
plt.title("Micro-averaged One-vs-Rest\nReceiver Operating Characteristic")
plt.legend({'AUC for classifier: '+str(auc)})
plt.show()
更多信息: https://scikit-learn.org/stable/modules/generated/sklearn.metrics.RocCurveDisplay.html
- salehinejad
0
使用scikit和sklearn的另一种解决方案
安装包:
pip3 install scikit-plot
使用这个解决方案,您可以控制图例,并且具有0.5的基准AUC。 Python代码:
from sklearn import metrics
import numpy as np
from sklearn.metrics import RocCurveDisplay
import matplotlib.pyplot as plt
import scikitplot as skplt

y_true = np.array([0, 0, 1, 1])
y_score = np.array([0.1, 0.4, 0.35, 0.8])


fpr, tpr, thresholds = metrics.roc_curve(y_true, y_score, pos_label=1)
auc = metrics.auc(fpr, tpr)
auc = format(auc, '.2f')

RocCurveDisplay.from_predictions(
    y_true,
    y_score,
    name="micro-average OvR",
    color="darkorange")

plt.plot(np.arange(0,1.1,0.1),np.arange(0,1.1,0.1),linestyle='-.',color='k')
plt.axis("square")
plt.xlabel("False Positive Rate")
plt.ylabel("True Positive Rate")
plt.title("Micro-averaged One-vs-Rest\nReceiver Operating Characteristic")
plt.legend({'AUC for classifier: '+str(auc)})
plt.show()
更多信息: https://scikit-learn.org/stable/modules/generated/sklearn.metrics.RocCurveDisplay.html
- salehinejad
网页内容由stack overflow 提供, 点击上面的可以查看英文原文,
原文链接
原文链接

y_train_true、y_train_prob、y_test_true、y_test_prob? - Md. Rezwanul Haquey_train_true, y_test_true应该在标记数据集中随时可用。y_train_prob, y_test_prob是您训练的神经网络的输出。 - Brian Chan