这段代码可以绘制带置信区间的ROC曲线:
ciobj <- ci.se(obj, specificities=seq(0, 1, l=25))
dat.ci <- data.frame(x = as.numeric(rownames(ciobj)),
                     lower = ciobj[, 1],
                     upper = ciobj[, 3])

ggroc(obj) + theme_minimal() + geom_abline(slope=1, intercept = 1, linetype = "dashed", alpha=0.7, color = "grey") + coord_equal() +
  geom_ribbon(data = dat.ci, aes(x = x, ymin = lower, ymax = upper), fill = "steelblue", alpha= 0.2) + ggtitle(capture.output(obj$ci))
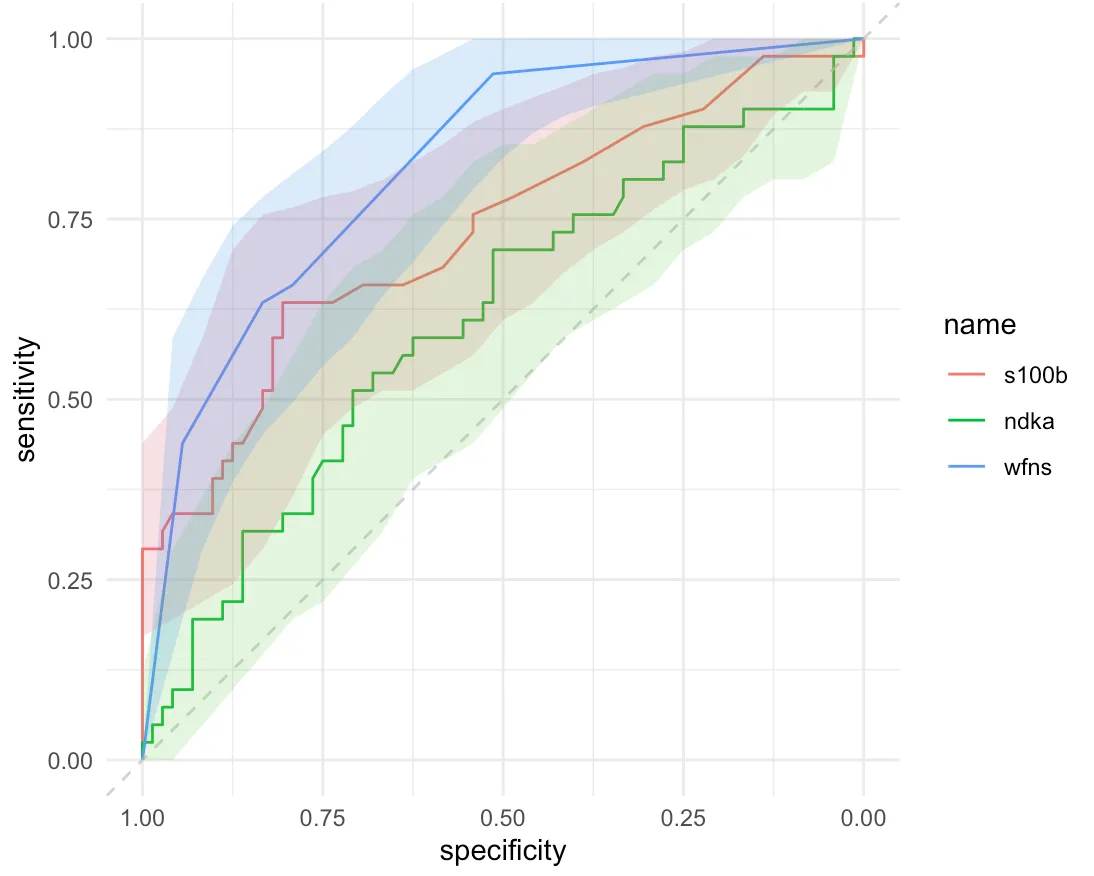
这段代码可以一起绘制多条ROC曲线
roc.list <- roc(outcome ~ s100b + ndka + wfns, data = aSAH)
g.list <- ggroc(roc.list)
g.list
但我无法将它们结合在一起:
ggroc(roc.list) + theme_minimal() + geom_abline(slope=1, intercept = 1, linetype = "dashed", alpha=0.7, color = "grey") + coord_equal() +
  geom_ribbon(data = dat.ci, aes(x = x, ymin = lower, ymax = upper), fill = "steelblue", alpha= 0.2) + ggtitle(capture.output(obj$ci))
如果出现错误,它会返回一个错误: