编辑:正如Dwin在评论中指出的那样,下面的代码不是ROC曲线。ROC曲线必须按照t的变化而不是lambda的变化进行索引(就像我在下面做的那样)。我会在有机会时编辑下面的代码。
下面是我尝试创建glmnet预测二元结果的ROC曲线的代码。我在下面的代码中模拟了一个近似于glmnet结果的矩阵。正如你们中的一些人所知道的那样,对于一个 n x p 的输入矩阵,glmnet输出一个n x 100的预测概率 [$\Pr(y_i = 1)$] 矩阵,对应100个不同 lambda 值。如果进一步改变lambda值不能增加预测能力,则输出将比100更窄。 下面的模拟glmnet预测概率矩阵是一个250x69矩阵。
首先,是否有更简单的方法来绘制glmnet ROC曲线?其次,如果没有,下面的方法是否正确?第三,我是否关心绘制(1)假/真阳性的概率还是(2)仅关注假/真阳性的观察率?
set.seed(06511)
# Simulate predictions matrix
phat = as.matrix(rnorm(250,mean=0.35, sd = 0.12))
lambda_effect = as.matrix(seq(from = 1.01, to = 1.35, by = 0.005))
phat = phat %*% t(lambda_effect)
#Choose a cut-point
t = 0.5
#Define a predictions matrix
predictions = ifelse(phat >= t, 1, 0)
##Simulate y matrix
y_phat = apply(phat, 1, mean) + rnorm(250,0.05,0.10)
y_obs = ifelse(y_phat >= 0.55, 1, 0)
#percentage of 1 observations in the validation set,
p = length(which(y_obs==1))/length(y_obs)
# dim(testframe2_e2)
#probability of the model predicting 1 while the true value of the observation is 0,
apply(predictions, 1, sum)
## Count false positives for each model
## False pos ==1, correct == 0, false neg == -1
error_mat = predictions - y_obs
## Define a matrix that isolates false positives
error_mat_fp = ifelse(error_mat ==1, 1, 0)
false_pos_rate = apply(error_mat_fp, 2, sum)/length(y_obs)
# Count true positives for each model
## True pos == 2, mistakes == 1, true neg == 0
error_mat2 = predictions + y_obs
## Isolate true positives
error_mat_tp = ifelse(error_mat2 ==2, 1, 0)
true_pos_rate = apply(error_mat_tp, 2, sum)/length(y_obs)
## Do I care about (1) this probability OR (2) simply the observed rate?
## (1)
#probability of false-positive,
p_fp = false_pos_rate/(1-p)
#probability of true-positive,
p_tp = true_pos_rate/p
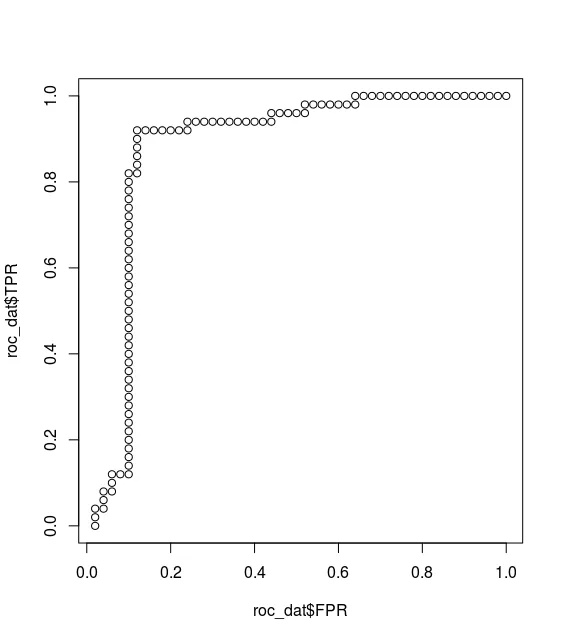
#plot the ROC,
plot(p_fp, p_tp)
## (2)
plot(false_pos_rate, true_pos_rate)
这个问题在SO上有一个回答,但是答案很粗糙,而且不太正确:glmnet lasso ROC charts
t时,才真正是“ROC曲线”吗? - Dr. Beeblebrox