如果您想单独绘制图形,请创建两个不同的轴,或者创建一个Axes对象并将其传递给nx.draw。例如:
如果要分别绘制两个图形,请创建两个不同的轴;如果要在同一张图中绘制两个图形,请创建一个Axes对象并将其传递给nx.draw函数。例如:
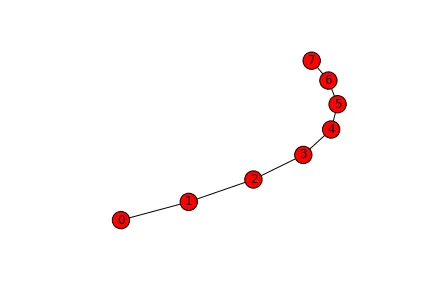
G = nx.path_graph(8)
E = nx.path_graph(30)
fig, ax = subplots()
nx.draw(G, ax=ax)
nx.draw(E, ax=ax)
获取:
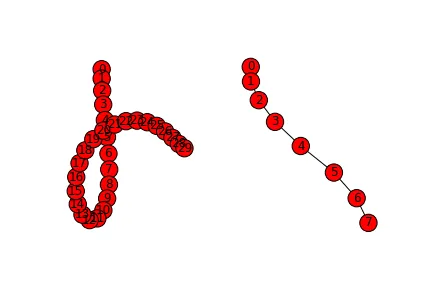
如果您想要两个不同的图形对象,则需要分别创建它们,如下所示:
G = nx.path_graph(8)
E = nx.path_graph(30)

# two separate graphs
fig1 = figure()
ax1 = fig1.add_subplot(111)
nx.draw(G, ax=ax1)

fig2 = figure()
ax2 = fig2.add_subplot(111)
nx.draw(G, ax=ax2)
产出:

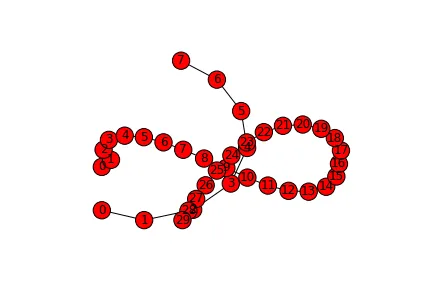
最后,如果你愿意的话,你可以创建一个子图,就像这样:
G = nx.path_graph(8)
E = nx.path_graph(30)

pos=nx.spring_layout(E,iterations=100)

subplot(121)
nx.draw(E, pos)

subplot(122)
nx.draw(G, pos)
导致:
无论价值如何,看起来在使用matplotlib的API创建pylab之外的子图时,nx.draw中的ax参数是无用的,因为nx.draw有一些对gca的调用,使其依赖于pylab接口。我没有深入研究这个问题,只是想指出这一点。
nx.draw的源代码非常简单:
try:
import matplotlib.pylab as pylab
except ImportError:
raise ImportError("Matplotlib required for draw()")
except RuntimeError:
print("Matplotlib unable to open display")
raise
cf=pylab.gcf()
cf.set_facecolor('w')
if ax is None:
if cf._axstack() is None:
ax=cf.add_axes((0,0,1,1))
else:
ax=cf.gca()
b = pylab.ishold()
h = kwds.pop('hold', None)
if h is not None:
pylab.hold(h)
try:
draw_networkx(G,pos=pos,ax=ax,**kwds)
ax.set_axis_off()
pylab.draw_if_interactive()
except:
pylab.hold(b)
raise
pylab.hold(b)
return
- 使用
gcf从环境中捕获一个图形。
- 然后,如果不存在,则向该图添加一个
Axes对象,否则使用gca从环境中获取它。
- 将绘图面颜色设置为白色。
- 打开
hold。
- 使用内部函数进行绘制。
- 关闭坐标轴。
- 最后,如果处于交互模式,则绘制并重新引发任何捕获到的异常。