请看这个GitHub页面。我想用 Python PIL、open cv 或 matplotlib 库以此方式生成热图。有人能帮我弄清楚吗?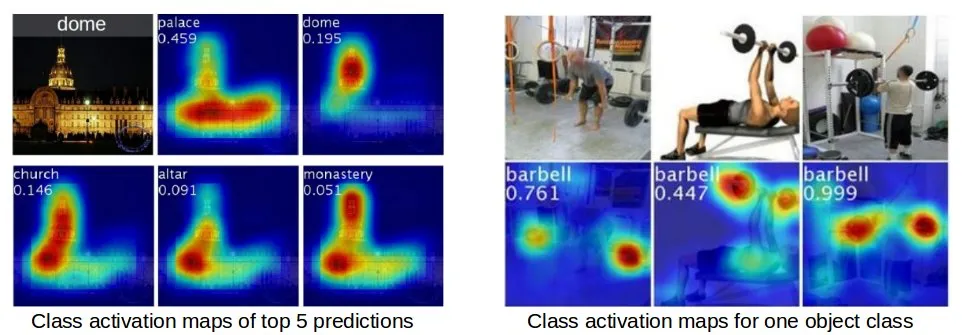 我可以创建一个与输入相同大小的网络热图,但是我无法将它们叠加。热图形状为(800,800),底图形状为(800,800,3)。
我可以创建一个与输入相同大小的网络热图,但是我无法将它们叠加。热图形状为(800,800),底图形状为(800,800,3)。
我可以创建一个与输入相同大小的网络热图,但是我无法将它们叠加。热图形状为(800,800),底图形状为(800,800,3)。在多次评论后,我决定用更好的可视化图表更新这篇文章。
请考虑以下图片:
img = cv2.imread('image_path')

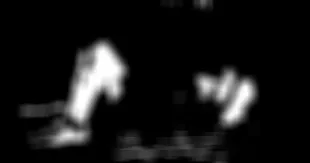
在将图像转换为LAB格式后,对其a通道进行二值化处理,得到了一个二进制图像:
lab = cv2.cvtColor(img, cv2.COLOR_BGR2LAB)
a_component = lab[:,:,1]
th = cv2.threshold(a_component,140,255,cv2.THRESH_BINARY)[1]

应用高斯模糊:
blur = cv2.GaussianBlur(th,(13,13), 11)
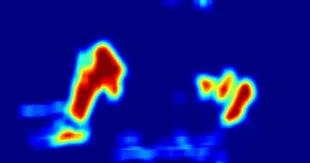
生成的热力图:
heatmap_img = cv2.applyColorMap(blur, cv2.COLORMAP_JET)
最后,将热力图叠加在原始图像上:
super_imposed_img = cv2.addWeighted(heatmap_img, 0.5, img, 0.5, 0)
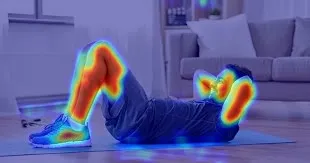
注意: 您可以改变函数cv2.addWeighted中的权重参数并观察差异。
import numpy as np
from cv2 import cv2
from skimage import exposure
...

capture = cv2.VideoCapture(...)
while True:
    ret, frame = capture.read()

    if ret:
        #resize original frame
        frame = cv2.resize(frame, (224, 224))

        #get color map
        cam = getMap(frame)
        map_img = exposure.rescale_intensity(cam, out_range=(0, 255))
        map_img = np.uint8(map_img)
        heatmap_img = cv2.applyColorMap(map_img, cv2.COLORMAP_JET)

        #merge map and frame
        fin = cv2.addWeighted(heatmap_img, 0.5, frame, 0.5, 0)

        #show result
        cv2.imshow('frame', fin)
我在这行代码处理灰度图像时遇到了一些问题
super_imposed_img = cv2.addWeighted(heatmap_img, 0.5, img, 0.5, 0)
但是这个代码对我起作用了
plt.imshow(binary_classification_result * 0.99 + original_gray_image * 0.01)
resnet_50 = tf.keras.applications.ResNet50(input_shape=(224, 224, 3),
                                           include_top=False,
                                           weights='imagenet')
img = cv2.imread("/content/your_image.jpg")[:,:,::-1]
img = cv2.resize(image, (224, 224))
ax = plt.imshow(img)

def preprocess(img):
  # use the pre processing function of ResNet50
  img = preprocess_input(img)

  #expand the dimension
  return np.expand_dims(img, 0)

input_image = preprocess(img)
def postprocess_activations(activations):

  output = np.abs(activations)
  output = np.sum(output, axis = -1).squeeze()

  #resize and convert to image
  output = cv2.resize(output, (224, 224))
  output /= output.max()
  output *= 255
  return 255 - output.astype('uint8')
def apply_heatmap(weights, img):

   #generate heat maps
   heatmap = cv2.applyColorMap(weights, cv2.COLORMAP_JET)
   heatmap = cv2.addWeighted(heatmap, 0.7, img, 0.3, 0)
return heatmap
 def plot_heatmaps(rng):
  level_maps = None

  #given a range of indices generate the heat maps
  for i in rng:
    activations = get_activations_at(input_image, i)
    weights = postprocess_activations(activations)
    heatmap = apply_heatmap(weights, img)
    if level_maps is None:
      level_maps = heatmap
    else:
      level_maps = np.concatenate([level_maps, heatmap], axis = 1)
  plt.figure(figsize=(15, 15))
  plt.axis('off')
  ax = plt.imshow(level_maps)
plot_heatmaps(range(164, 169))