是否有一个statsmodels API可以从statsmodels时间序列模型中检索预测区间?
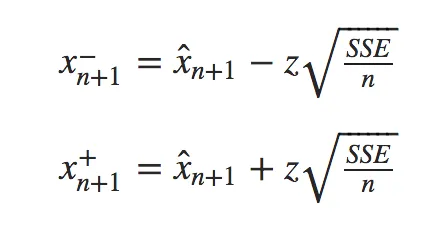
目前,我正在使用手动计算预测区间:
这是我的代码。首先,获取一些示例数据...
! python -c 'import datapackage' || pip install datapackage

%matplotlib inline

import datapackage

from statsmodels.graphics.tsaplots import plot_acf
from statsmodels.tsa.api import SimpleExpSmoothing
import statsmodels.api as sm
import pandas as pd
import numpy as np
import matplotlib.pyplot as plt

def get_data():
    # data licensed for non-commercial use only - https://datahub.io/core/bond-yields-uk-10y
    data_url = 'https://datahub.io/core/bond-yields-uk-10y/datapackage.json'

    resources = datapackage.Package(data_url).resources

    quarterly_csv_url = [pkg for pkg in resources if pkg.name == 'quarterly_csv'][0].descriptor['path']
    data = pd.read_csv(quarterly_csv_url)
    data = data.set_index('Date', drop=True).asfreq('Q')
    return data
接下来,创建一个预测并计算间隔:
data = get_data()
data = data[ data.index > '2005/']

fit = SimpleExpSmoothing(data).fit()
fcast = fit.forecast(1).rename('Forecast')
xhat = fcast.get_values()[0]

z = 1.96
sse = fit.sse
predint_xminus = xhat - z * np.sqrt(sse/len(data))
predint_xplus  = xhat + z * np.sqrt(sse/len(data))
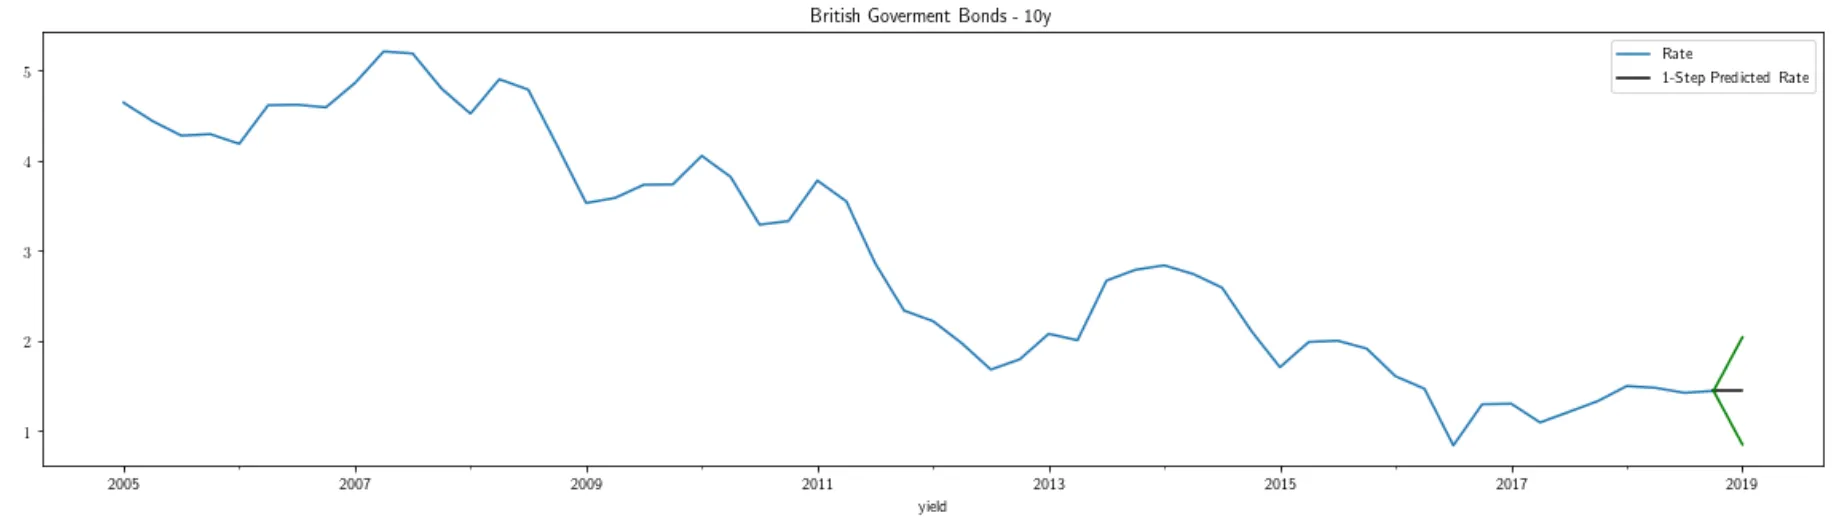
绘制区间...
plt.rcParams["figure.figsize"] = (20,5)

ax = data.plot(legend=True, title='British Goverment Bonds - 10y')
ax.set_xlabel('yield')

#
# 1-Step Prediction
#
prediction = pd.DataFrame(
    data  = [ data.values[-1][0],  xhat ],
    index = [ data.index[-1],      data.index[-1] + 1 ],
    columns = ['1-Step Predicted Rate']
)
_ = prediction.plot(ax=ax, color='black')

#
# upper 95% prediction interval
#
upper_pi_data = pd.DataFrame(
    data  = [ xhat,           predint_xplus ],
    index = [ data.index[-1], data.index[-1] + 1 ]
)
_ = upper_pi_data.plot(ax=ax, color='green', legend=False)

#
# lower 95% prediction interval
#
lower_pi_data = pd.DataFrame(
    data  = [ xhat,           predint_xminus ],
    index = [ data.index[-1], data.index[-1] + 1 ]
)
_ = lower_pi_data.plot(ax=ax, color='green', legend=False)
我找到了类似的问题,但不是针对时间序列模型: