我想知道能否更改使用 arrows() 绘制的箭头的箭头端。 我查看了文档,但发现我只能更改线条的末端而无法更改箭头的末端?
plot(c(1:10))
arrows(0,0,10,10)
感激不尽,期待您的帮助 :)
如在?arrow中所解释的那样,您可以使用length和angle来改变标准箭头的外观。使用lwd可以更改线条的粗细,就像在lines()中一样。此外,lty也有效,但结果通常不太好看。
以下是一整套的示例:
plot(c(0:10),type="n")

arrows(1,0,2,1,length=0.2,angle=20)
arrows(1,1,2,2,length=0.1,angle=40,lwd=3)

invisible(mapply(arrows,
        rep(c(3,6),each=4),rep(3:6,2),
        rep(c(5,8),each=4),rep(5:8,2),
        angle=seq(10,40,length.out=8),
        length=rep(seq(0.1,0.3,length.out=4),2),
        lwd=rep(1:4,each=2))
)
lwd来改变线条的粗细。请参考修改后的代码。 - Joris MeysKarline Soetaert 的软件包shape 对于此类目的非常有用:
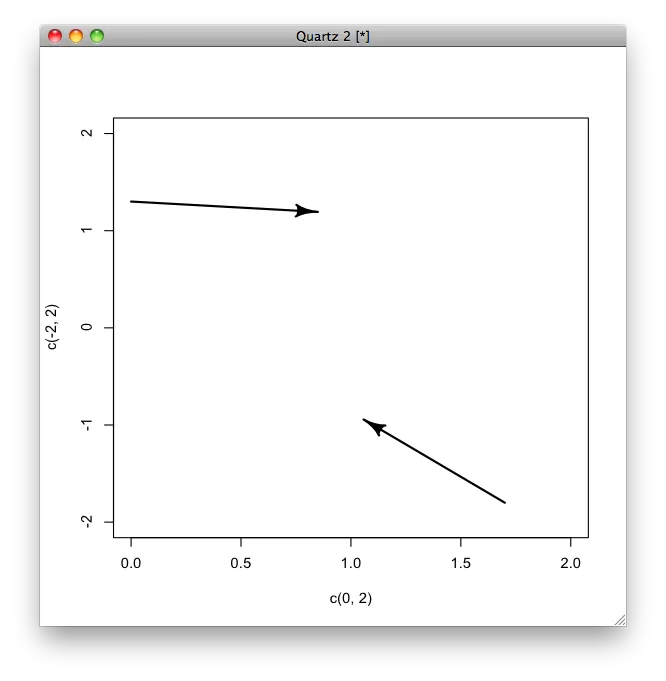
library(shape)
plot(c(0,2),c(-2,2), col=NA)
Arrows(c(0,1.7),c(1.3,-1.8),c(0.8,1.1),c(1.2,-1), lwd=2)
 一定要喜欢CRAN!
TeachingDemos包中的my.symbols函数。这个函数可以让你创建自定义箭头并将它们绘制出来。ms.arrows函数展示了一种实现方法:你可以修改这个函数(或者其他ms.*函数)来创建任何类型的箭头,然后再使用my.symbols函数绘制出来。
编辑
以下是一个示例,如所请求的内容:library(TeachingDemos)
ms.arrowhead <- function(angle, ...) {
xy <- cbind( c(-1, -0.75, -1, 0),
c(-0.5, 0, 0.5, 0) )
xy <- xy %*% matrix(c(cos(angle),-sin(angle),sin(angle),cos(angle)), 2)
xspline(xy, shape=c(0, -1, 0, 0), open=FALSE, ...)
}
plot(1:10, 1:10)
my.symbols(1:10, 1:10, ms.arrows, angle=seq(pi, 0, length=10),
col='blue', adj=1, length=0, symb.plots=TRUE)
my.symbols(1:10, 1:10, ms.arrowhead, angle= seq(pi, 0, length=10),
col='green', inches=0.5, lwd=2, symb.plots = TRUE)
这里使用xspline函数绘制一个带有弯曲背部的三角形箭头。可以修改点来获得不同形状的箭头,或者使用其他方法来创建形状。
panel.arrows()函数,可以使用type参数指定箭头类型为“open”或“closed”,如果你需要使用Lattice绘图,这将非常有用。可惜这个功能不在基础arrows()函数中。 - Gavin Simpson