在R中有一个称为海盗图的漂亮图形。它是箱线图和点图的组合。我该如何使用seaborn在Python中绘制类似的图形呢? 您可以在此处找到示例:http://rpubs.com/yarrr/pirateplot
在seaborn中创建海盗图(箱线图和点图的组合)
5
- Georg Heiler
1
1很难确定你真正想要什么,但我建议阅读关于分类数据绘图的文档。 - Vinícius Figueiredo
1个回答
5
这是我能想到的最接近pirateplot的方法。使用seaborn的
导致产生这个图表。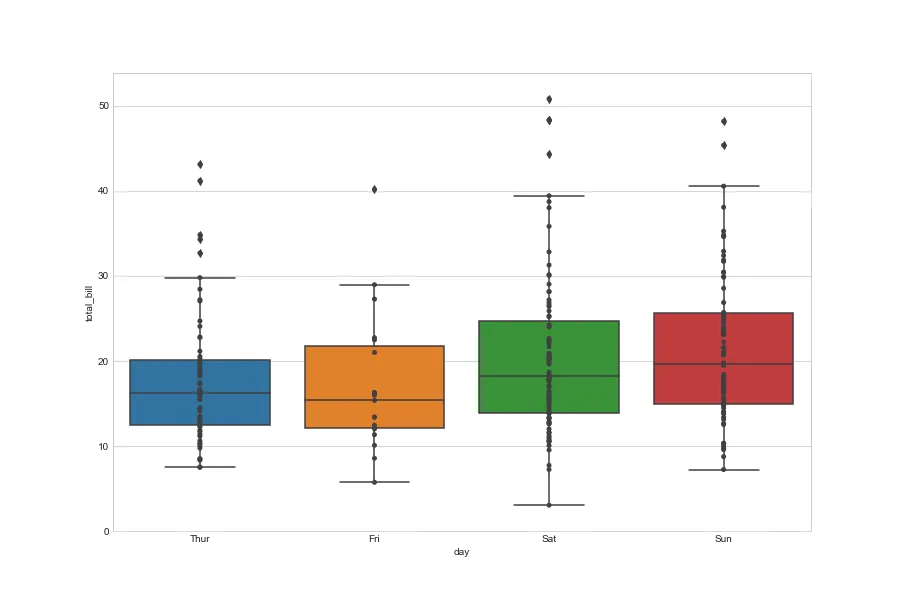
boxplot和stripplot两种图表类型。sns.set_style("whitegrid")
tips = sns.load_dataset("tips")
ax = sns.boxplot(x="day", y="total_bill", data=tips)
ax = sns.stripplot(x="day", y="total_bill", data=tips, color=".25")
导致产生这个图表。
- error
网页内容由stack overflow 提供, 点击上面的可以查看英文原文,
原文链接
原文链接