在Python的Seaborn中创建一个箱线图FacetGrid

6
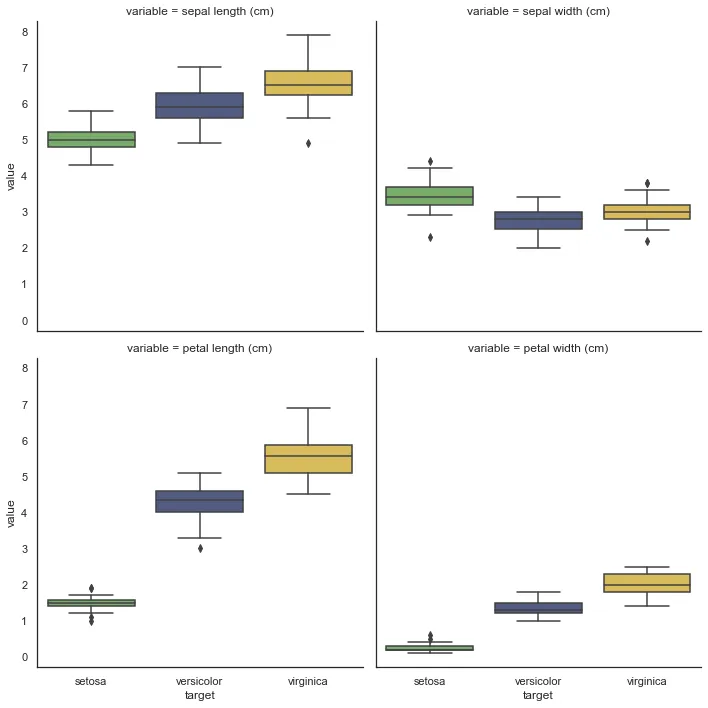
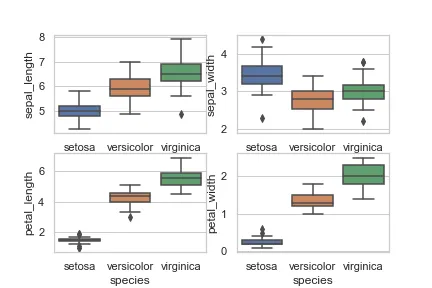
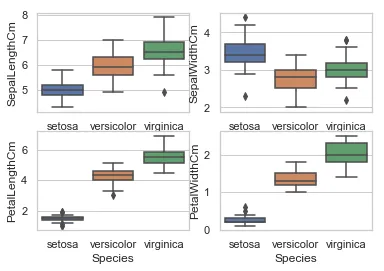
我正在尝试在seaborn中创建一个4x4的FacetGrid,其中包含4个箱线图,每个箱线图基于鸢尾花数据集中的鸢尾花物种分为3个箱线图。目前,我的代码如下:
sns.set(style="whitegrid")
iris_vis = sns.load_dataset("iris")

fig, axes = plt.subplots(2, 2)

ax = sns.boxplot(x="Species", y="SepalLengthCm", data=iris, orient='v', 
    ax=axes[0])
ax = sns.boxplot(x="Species", y="SepalWidthCm", data=iris, orient='v', 
    ax=axes[1])
ax = sns.boxplot(x="Species", y="PetalLengthCm", data=iris, orient='v', 
    ax=axes[2])
ax = sns.boxplot(x="Species", y="PetalWidthCm", data=iris, orient='v', 
    ax=axes[3])

然而,我的解释器出现了以下错误:
AttributeError: 'numpy.ndarray' object has no attribute 'boxplot'

我对这里出现的属性错误感到困惑。我需要做出哪些改变?
4个回答

8

这并不是直接回答你的错误,但如果你要使用seaborn,应该尽量坚持使用"long"或"tidy"数据(https://seaborn.pydata.org/tutorial/data_structure.html#long-form-data)。

我假设你的原始数据集是宽格式(每个观察特征都有一列)。如果像下面这样将数据集进行融合处理:

iris = iris.melt(id_vars='target')

print(iris.head())

   target           variable  value
0  setosa  sepal length (cm)    5.1
1  setosa  sepal length (cm)    4.9
2  setosa  sepal length (cm)    4.7
3  setosa  sepal length (cm)    4.6
4  setosa  sepal length (cm)    5.0

你可以使用seaborn的catplot来绘制箱线图,只需将kind='box'作为参数传递即可。

sns.catplot(
    data=iris, x='target', y='value',
    col='variable', kind='box', col_wrap=2
)

boxplot


1
在sns.catplot调用中添加sharey = False,如果您想为每个变量获得更高的分辨率,则可以使y轴不同。 - veg2020

3

axes的形状是(nrows, ncols)。在这种情况下,它是:

array([[<matplotlib.axes._subplots.AxesSubplot object at 0x7f4267f425f8>,
        <matplotlib.axes._subplots.AxesSubplot object at 0x7f4267f1bb38>],
       [<matplotlib.axes._subplots.AxesSubplot object at 0x7f4267ec95c0>,
        <matplotlib.axes._subplots.AxesSubplot object at 0x7f4267ef9080>]],
      dtype=object)

因此,当你执行ax=axes[0]时,你得到的是一个数组而不是轴。尝试使用以下代码:
fig, axes = plt.subplots(2, 2)

ax = sns.boxplot(x="Species", y="SepalLengthCm", data=iris, orient='v', 
    ax=axes[0, 0])
ax = sns.boxplot(x="Species", y="SepalWidthCm", data=iris, orient='v', 
    ax=axes[0, 1])
ax = sns.boxplot(x="Species", y="PetalLengthCm", data=iris, orient='v', 
    ax=axes[1, 0])
ax = sns.boxplot(x="Species", y="PetalWidthCm", data=iris, orient='v', 
    ax=axes[1, 1])

example_plot


3

因为正如 @Lucas 所指出的,axes返回一个二维的numpy数组(nrows,ncols),您可以使用以下方法将此数组展平为一维:

axes=axes.flatten()

同时,您可以像这样保留相同的代码:

fig, axes = plt.subplots(2, 2)
axes = axes.flatten()

ax = sns.boxplot(x="Species", y="SepalLengthCm", data=iris, orient='v', 
    ax=axes[0])
ax = sns.boxplot(x="Species", y="SepalWidthCm", data=iris, orient='v', 
    ax=axes[1])
ax = sns.boxplot(x="Species", y="PetalLengthCm", data=iris, orient='v', 
    ax=axes[2])
ax = sns.boxplot(x="Species", y="PetalWidthCm", data=iris, orient='v', 
    ax=axes[3])

输出:

在此输入图像描述


0

或者更简洁地说:

cat_variables = ['SepalLengthCm', 'SepalWidthCm', 'PetalLengthCm', 'PetalWidthCm']
x_var = "Species"
fig, axes = plt.subplots(len(cat_variables)/2, len(cat_variables)/2, figsize=(15,15))
axes = axes.flatten()

i = 0
for t in cat_variables:
    ax = sns.boxplot(x=x_var, y=TARGET, data=iris, orient='v', 
    ax=axes[i])
    i +=1

获取错误:TypeError: 'float'对象无法解释为整数 - vasili111

网页内容由stack overflow 提供, 点击上面的
可以查看英文原文,
原文链接