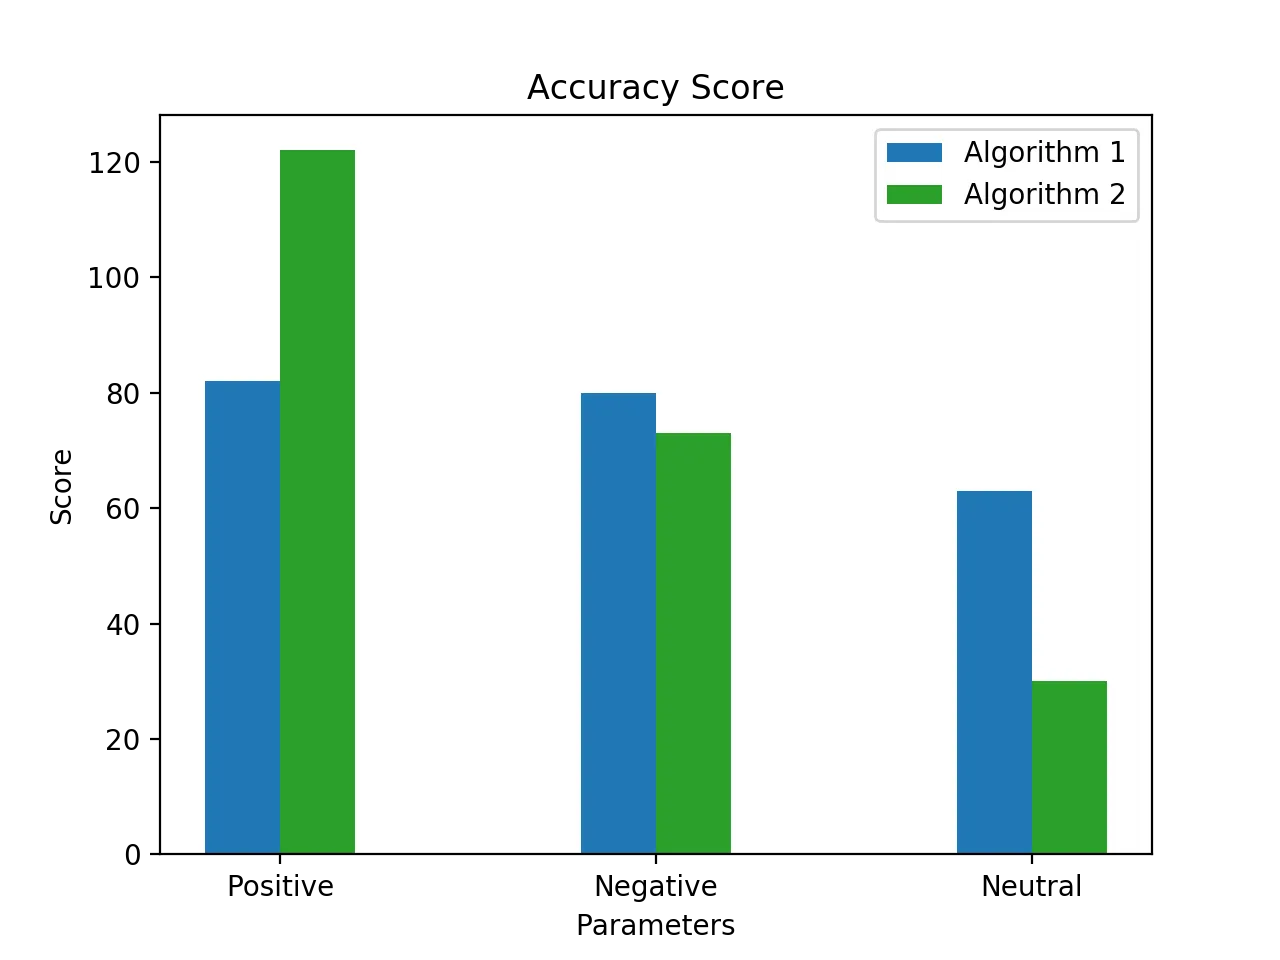
我有这两个{ndarray},其中包含正面、负面和中性得分三个值。
>>>y1
array([82, 80, 63])
>>>y2
array([122,  73,  30])
我需要将y1[0]和y2[0]一起绘制,因为它们对应的是正值,其他两个数组也是如此。
我尝试了以下方法:
import matplotlib.pyplot as plt
import numpy as np

def biplt(groundTruth, predictedValues, plt_name='<name>'):
        gt = groundTruth
        pr = predictedValues
        x = np.arange(2)

        y1, y2 = gt.values, pr.values
        fig, axes = plt.subplots(ncols=1, nrows=1)

        width = 0.20
        plt.title('%s\n Accuracy Score' % plt_name)
        plt.xlabel('Parameters')
        plt.ylabel('Score')
        axes.bar(x, y1, width, label="Algorithm 1")
        axes.bar(x + width, y2, width, color=list(plt.rcParams['axes.prop_cycle'])[2]['color'], label="Algorithm 2")
        axes.set_xticks(x + width)
        axes.set_xticklabels(['Positive', 'Negative'])
        plt.legend()
        plt.show()
这导致了ValueError错误,请查看以下内容:
ValueError: 形状不匹配:无法将对象广播到单个形状
我无法诊断可能的形状问题
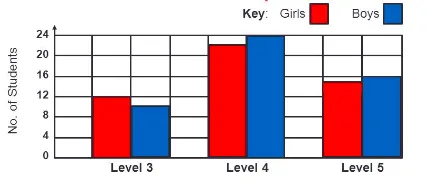
我期望类似于下面的输出: