如何在Python中应用分段线性拟合?

86

我正在尝试为一个数据集拟合分段线性拟合,如图1所示。
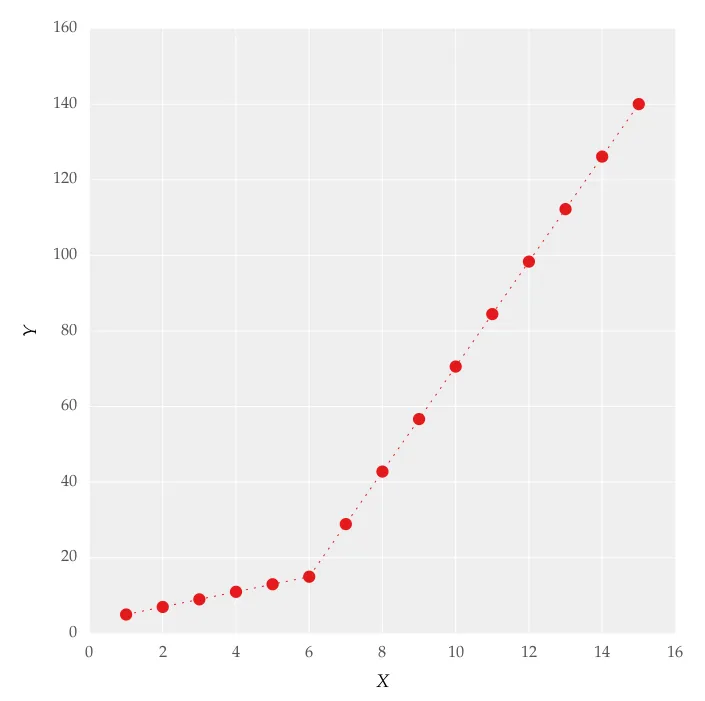
enter image description here

这个图是通过在线上设置得到的。我尝试使用以下代码应用分段线性拟合:

from scipy import optimize
import matplotlib.pyplot as plt
import numpy as np


x = np.array([1, 2, 3, 4, 5, 6, 7, 8, 9, 10 ,11, 12, 13, 14, 15])
y = np.array([5, 7, 9, 11, 13, 15, 28.92, 42.81, 56.7, 70.59, 84.47, 98.36, 112.25, 126.14, 140.03])


def linear_fit(x, a, b):
    return a * x + b
fit_a, fit_b = optimize.curve_fit(linear_fit, x[0:5], y[0:5])[0]
y_fit = fit_a * x[0:7] + fit_b
fit_a, fit_b = optimize.curve_fit(linear_fit, x[6:14], y[6:14])[0]
y_fit = np.append(y_fit, fit_a * x[6:14] + fit_b)


figure = plt.figure(figsize=(5.15, 5.15))
figure.clf()
plot = plt.subplot(111)
ax1 = plt.gca()
plot.plot(x, y, linestyle = '', linewidth = 0.25, markeredgecolor='none', marker = 'o', label = r'\textit{y_a}')
plot.plot(x, y_fit, linestyle = ':', linewidth = 0.25, markeredgecolor='none', marker = '', label = r'\textit{y_b}')
plot.set_ylabel('Y', labelpad = 6)
plot.set_xlabel('X', labelpad = 6)
figure.savefig('test.pdf', box_inches='tight')
plt.close()    

但是这让我得到了图2中的形式拟合,我尝试改变值但是没有任何变化,我无法得到上线的适当匹配。对我来说最重要的要求是如何让Python获取梯度变化点。本质上,我想让Python在适当的范围内识别和拟合两个线性拟合。这在Python中怎么做?

12个回答

1

piecewise 也可以使用

from piecewise.regressor import piecewise
import numpy as np

x = np.array([1, 2, 3, 4, 5, 6, 7, 8, 9, 10 ,11, 12, 13, 14, 15,16,17,18], dtype=float)
y = np.array([5, 7, 9, 11, 13, 15, 28.92, 42.81, 56.7, 70.59, 84.47, 98.36, 112.25, 126.14, 140.03,120,112,110])

model = piecewise(x, y)

评估 'model':

FittedModel with segments:
* FittedSegment(start_t=1.0, end_t=7.0, coeffs=(2.9999999999999996, 2.0000000000000004))
* FittedSegment(start_t=7.0, end_t=16.0, coeffs=(-68.2972222222222, 13.888333333333332))
* FittedSegment(start_t=16.0, end_t=18.0, coeffs=(198.99999999999997, -5.000000000000001))

1
这里已经有很好的答案了,但是这里有另一种使用简单神经网络的方法。基本思路与其他答案相同,即:

  • 创建虚拟变量以指示输入变量是否大于某个分界点
  • 通过将分界点从输入变量中减去并将结果乘以相应的虚拟变量来创建虚拟交互项
  • 使用输入变量和虚拟交互项作为特征训练线性模型

主要区别在于,这里的分界点是通过梯度下降端到端学习而不是作为超参数处理的。这种方法自然地扩展到多个分界点,并且可以与任何相关的损失函数一起使用。

import torch
import numpy as np
import matplotlib.pyplot as plt

x = np.array([1, 2, 3, 4, 5, 6, 7, 8, 9, 10, 11, 12, 13, 14, 15])
y = np.array([5, 7, 9, 11, 13, 15, 28.92, 42.81, 56.7, 70.59,
              84.47, 98.36, 112.25, 126.14, 140.03])

定义模型、优化器和损失函数:

class PiecewiseLinearModel(torch.nn.Module):
    def __init__(self, n_breaks):
        super(PiecewiseLinearModel, self).__init__()
        self.breaks = torch.nn.Parameter(torch.randn((1,n_breaks)))
        self.linear = torch.nn.Linear(n_breaks+1, 1)        
    def forward(self, x):
        return self.linear(torch.cat([x, torch.clamp_min(x - self.breaks, 0)],1))

plm = PiecewiseLinearModel(n_breaks=1)
optimizer = torch.optim.Adam(plm.parameters(), lr=0.1)
loss_func = torch.nn.functional.mse_loss

训练模型:

x_torch = torch.tensor(x, dtype=torch.float)[:,None]
y_torch = torch.tensor(y)[:,None]
for _ in range(10000):
    p = plm(x_torch)
    optimizer.zero_grad()
    loss_func(y_torch, p).backward()
    optimizer.step()

绘制预测结果:

x_grid = np.linspace(0,16,1000)
p = plm(torch.tensor(x_grid, dtype=torch.float)[:,None])
p = p.flatten().detach().numpy()
plt.plot(x, y, ".")
plt.plot(x_grid, p)
plt.show()

toy piecewise linear model

检查模型参数:

print(plm.state_dict())
> OrderedDict([('breaks', tensor([[6.0033]])),
               ('linear.weight', tensor([[ 1.9999, 11.8892]])),
               ('linear.bias', tensor([2.9963]))])

神经网络的预测等同于:
def f(x): 
   return 1.9999*x + 11.8892*(x - 6.0033)*(x > 6.0033) + 2.9963

网页内容由stack overflow 提供, 点击上面的
可以查看英文原文,
原文链接