在Python中拟合分段对数正态数据

3
我有一组按体积分数百分比排列的粒径分布数据,如下所示:
size   %
6.68   0.05
9.92   1.15
etc.

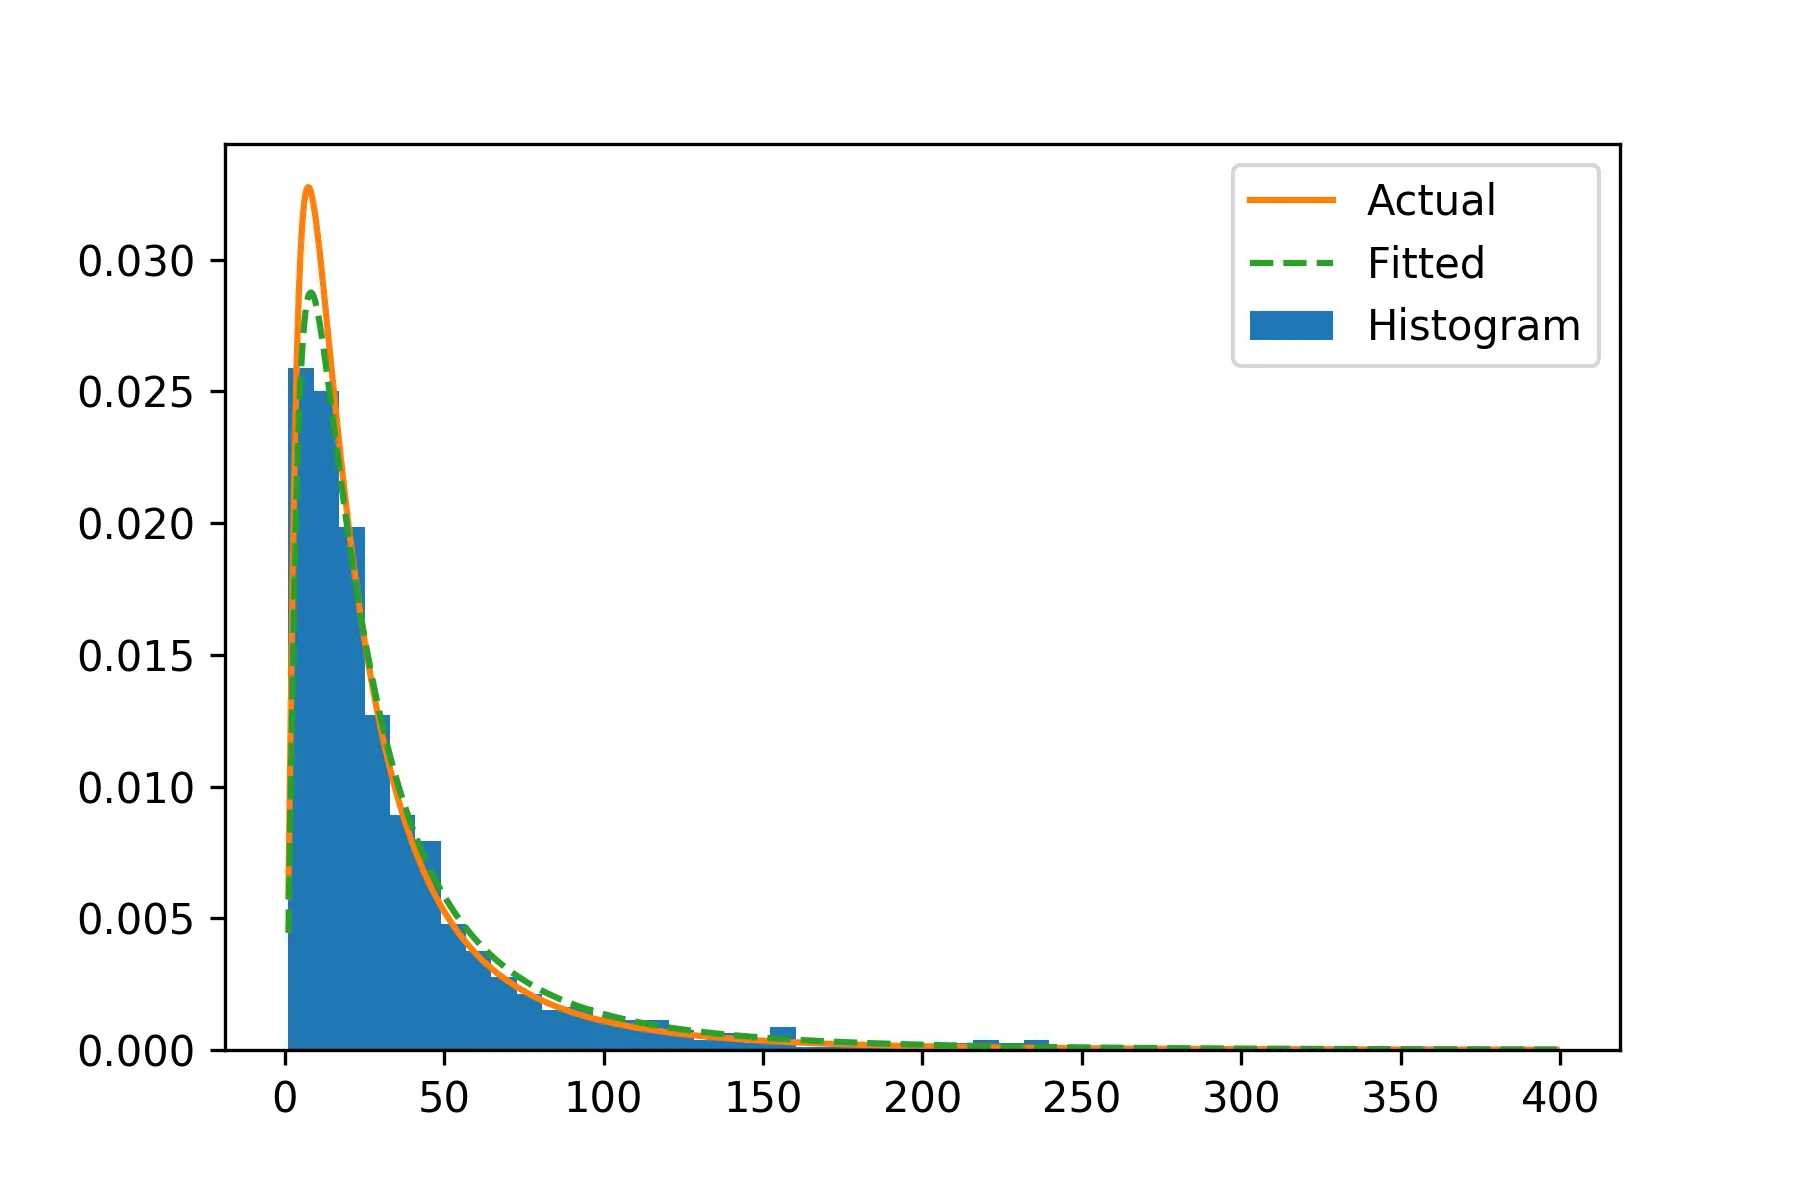
我需要将这些数据拟合成对数正态分布,计划使用Python的 stats.lognorm.fit 函数来实现,但根据我所阅读到的,这似乎需要将输入作为一个变量数组而不是分组数据。

我计划使用for循环遍历数据,并将每个大小条目.extend到一个占位符数组中,以创建与分组数据相对应的变量列表数组。

尽管如此,这似乎非常丑陋和低效,可能有一种简单的方法可以解决。是否有一种方法可以将分组数据输入到stats.lognorm.fit函数中?


我错误地得出结论,你已经制表了累积百分比。 - Bill Bell
1个回答

1

我猜想一种可能的解决方法是手动将pdf拟合到您的bin数据上,假设x值是每个间隔的中点,y值是相应的bin频率。然后使用scipy.optimize.curve_fit基于x和y值拟合曲线。我认为结果的准确性将取决于您拥有的bin数量。下面是一个示例:

import matplotlib.pyplot as plt
from scipy.optimize import curve_fit
import numpy as np

def pdf(x, mu, sigma):
    """pdf of lognormal distribution"""

    return (np.exp(-(np.log(x) - mu)**2 / (2 * sigma**2)) / (x * sigma * np.sqrt(2 * np.pi)))

mu, sigma = 3., 1.                              # actual parameter value

data = np.random.lognormal(mu, sigma, size=1000)       # data generation
h = plt.hist(data, bins=30, normed = True)

y = h[0]                                        # frequencies for each bin, this is y value to fit 
xs = h[1]                                       # boundaries for each bin
delta = xs[1] - xs[0]                           # width of bins
x = xs[:-1] + delta /                           # midpoints of bins, this is x value to fit

popt, pcov = curve_fit(pdf, x, y, p0=[1, 1])    # data fitting, popt contains the fitted parameters
print(popt)
# [ 3.13048122  1.01360758]                       fitting results

fig, ax = plt.subplots()
ax.hist(data, bins=30, normed=True, align='mid', label='Histogram')
xr = np.linspace(min(xs), max(xs), 10000)
yr = pdf(xr, mu, sigma)
yf = pdf(xr, *popt)
ax.plot(xr, yr, label="Actual")
ax.plot(xr, yf, linestyle = 'dashed', label="Fitted")
ax.legend()

enter image description here


谢谢你们两个。 - Sam Robinson
当箱子大小不统一时,curve_fit 将无法正常工作。 - Jakub Klinkovský

网页内容由stack overflow 提供, 点击上面的
可以查看英文原文,
原文链接