我遇到了一个问题,就是如何在图外显示两个图例。
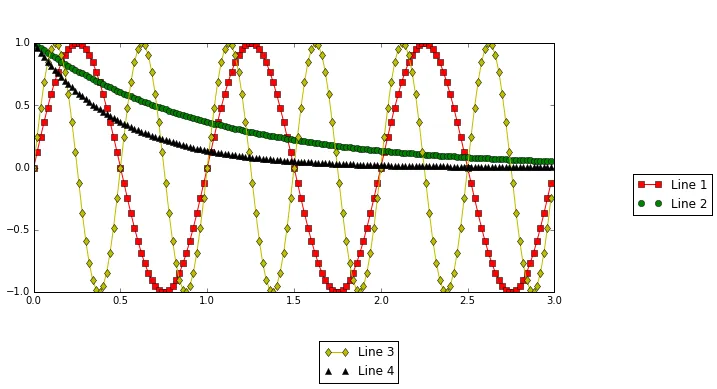
在图内显示多个图例很容易,matplotlib文档中有相关示例。
即使在图外显示一个图例也相对容易,我在stackoverflow上找到了相关实例(例如这里)。
但是我无法找到能够在图外显示两个图例的可行示例。
适用于一个图例的方法在这种情况下不起作用。
下面是一个示例。 首先是基本代码:
下面是一个示例。 首先是基本代码:
import matplotlib.pyplot as plt
import matplotlib.patches as patches
from matplotlib.lines import Line2D
from matplotlib.font_manager import FontProperties

fig1 = plt.figure(figsize=(17,5))
fontP = FontProperties()
fontP.set_size('small')
ax1 = fig1.add_subplot(111, aspect='equal')
ax1.grid()


# stuff for legend
rec1 = patches.Rectangle(
    (0.9, 0.25),   # (x,y)
    0.1,          # width
    0.1,          # height
    label='rectangle',
    **{
        'color': 'blue'
    }

)
ax1.add_patch(rec1)

leg = plt.legend(handles=[rec1], bbox_to_anchor=(0.7, -0.1))
fig1.savefig('sample1.png', dpi=90, bbox_inches='tight')
但是现在我想在绘图的右侧再画一个图例。 以下是代码:
...
ax1.add_patch(rec1)

l1 = plt.legend(prop=fontP, handles=[rec1], loc='center left',
                box to_anchor=(1.0, 0.5))
plt.gca().add_artist(l1)

...
结果如下:
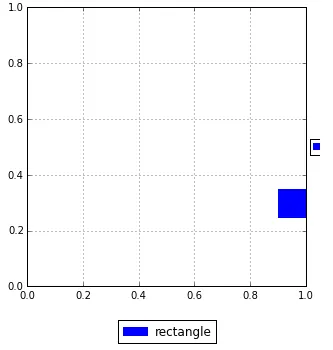
可以看到,第二个图例被截断了。 我的结论是matplotlib忽略了使用添加的对象的大小和位置。
plt.gca().add_artist(obj)
我该如何解决这个问题?
到目前为止,我找到了一个解决方案,但它非常糟糕:
创建三个图例,其中两个是附加的(通过add_artist添加),一个是普通的图例。 在Matplotlib尊重正常图例的位置和大小的情况下,将其移动到右下角并使用以下代码进行隐藏:
leg.get_frame().set_alpha(0)
以下是结果(示例未设置alpha):
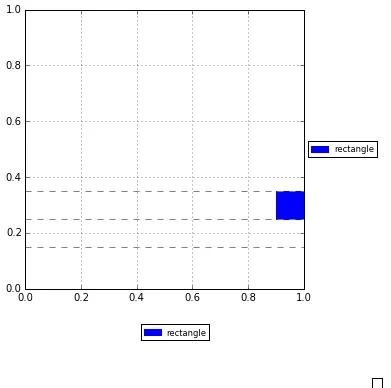
它的行为方式正是我想要的,但你知道它很讨厌。 以下是最终代码:
import matplotlib.pyplot as plt
import matplotlib.patches as patches
from matplotlib.lines import Line2D
from matplotlib.font_manager import FontProperties

fig1 = plt.figure(figsize=(17,5))
fontP = FontProperties()
fontP.set_size('small')
ax1 = fig1.add_subplot(111, aspect='equal')
ax1.grid()

# stuff for additional legends
rec1 = patches.Rectangle(
    (0.9, 0.25),   # (x,y)
    0.1,          # width
    0.1,          # height
    label='rectangle',
    **{
        'color': 'blue'
    }
)
ax1.add_patch(rec1)

# example additional legends
l1 = plt.legend(prop=fontP, handles=[rec1], loc='center left',
bbox_to_anchor=(1.0, 0.5))
l2 = plt.legend(prop=fontP, handles=[rec1], loc=3, bbox_to_anchor=(0.4,
-0.2))

# add legends
plt.gca().add_artist(l1)
plt.gca().add_artist(l2)

# add third legend
leg = plt.legend(handles=[], bbox_to_anchor=(1.3, -0.3))
leg.get_frame().set_alpha(0) # hide legend

fig1.savefig('sample3.png', dpi=90, bbox_inches='tight')
 。
。