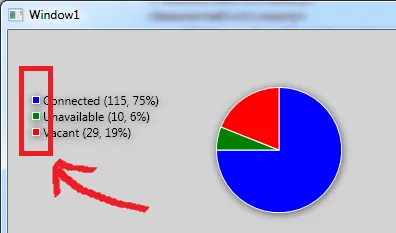
我该如何放大这些矩形?我正在使用wpf工具包中的图表,尝试过调整控制图例大小,但没有帮助。

使用Blend,在对象面板中:
右键单击[PieSeries]
-编辑其他模板
-编辑LegendItemStyle
-编辑副本
您应该会得到一个默认样式:
<Style x:Key="PieChartLegendItemStyle" TargetType="{x:Type chartingToolkit:LegendItem}">
    <Setter Property="IsTabStop" Value="False" />
    <Setter Property="Template">
        <Setter.Value>
            <ControlTemplate TargetType="{x:Type chartingToolkit:LegendItem}">
                <Border Background="{TemplateBinding Background}" BorderBrush="{TemplateBinding BorderBrush}" BorderThickness="{TemplateBinding BorderThickness}">
                    <StackPanel Orientation="Horizontal">
                        <Rectangle Width="8" Height="8" Fill="{Binding Background}" Stroke="{Binding BorderBrush}" StrokeThickness="1" Margin="0,0,3,0" />
                        <visualizationToolkit:Title Content="{TemplateBinding Content}" />
                    </StackPanel>
                </Border>
            </ControlTemplate>
        </Setter.Value>
    </Setter>
</Style>
你的控件将获得一个LegendItemStyle
<Charting:PieSeries ItemsSource="{Binding PutYourBindingHere}"
                                    IndependentValueBinding="{Binding Key}" DependentValueBinding="{Binding Value}" IsSelectionEnabled="True" LegendItemStyle="{DynamicResource PieChartLegendItemStyle}">
visualizationToolkit可在"clr-namespace:System.Windows.Controls.DataVisualization;assembly=System.Windows.Controls.DataVisualization.Toolkit"找到。 - Yoav