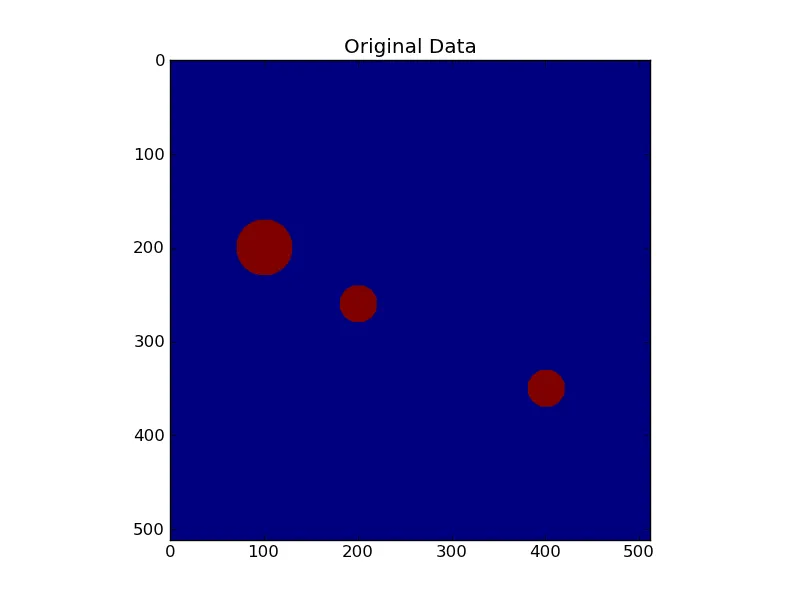
我的目标是追踪包含许多分离形状的图纸,并将这些形状拆分为单独的图像。图案为黑白。尽管我对numpy、opencv&co不太熟悉,但这是我的当前想法:
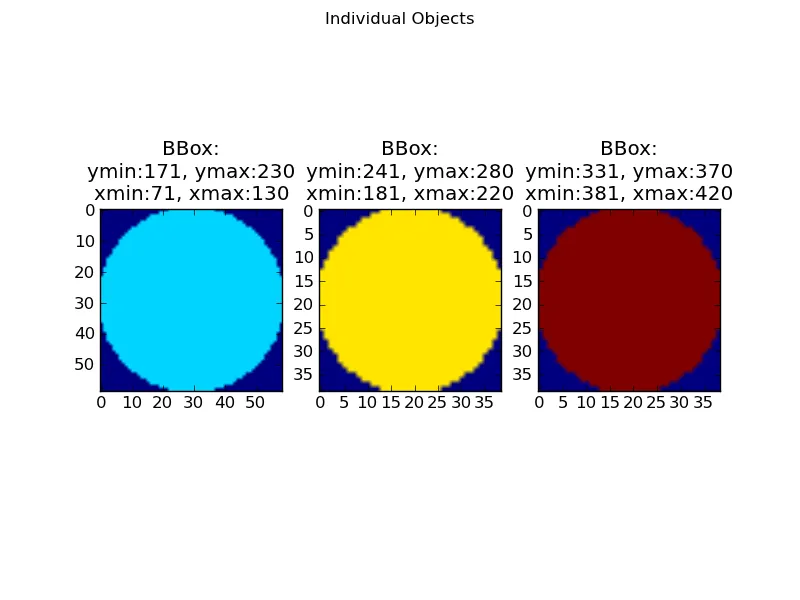
首先我试图找到分水岭结果的矩形边界框(这更或多少是一组例子的拼贴):
接下来的步骤可能是找到形状周围的多边形路径,但现在先用边界框就好了!
请帮忙!
- 扫描黑色像素
- 发现黑色像素 -> 分水岭
- 找到分水岭边界(作为多边形路径)
- 继续搜索,但忽略已经找到边界内的点
首先我试图找到分水岭结果的矩形边界框(这更或多少是一组例子的拼贴):
from numpy import *
import numpy as np
from scipy import ndimage
np.set_printoptions(threshold=np.nan)
a = np.zeros((512, 512)).astype(np.uint8) #unsigned integer type needed by watershed
y, x = np.ogrid[0:512, 0:512]
m1 = ((y-200)**2 + (x-100)**2 < 30**2)
m2 = ((y-350)**2 + (x-400)**2 < 20**2)
m3 = ((y-260)**2 + (x-200)**2 < 20**2)
a[m1+m2+m3]=1
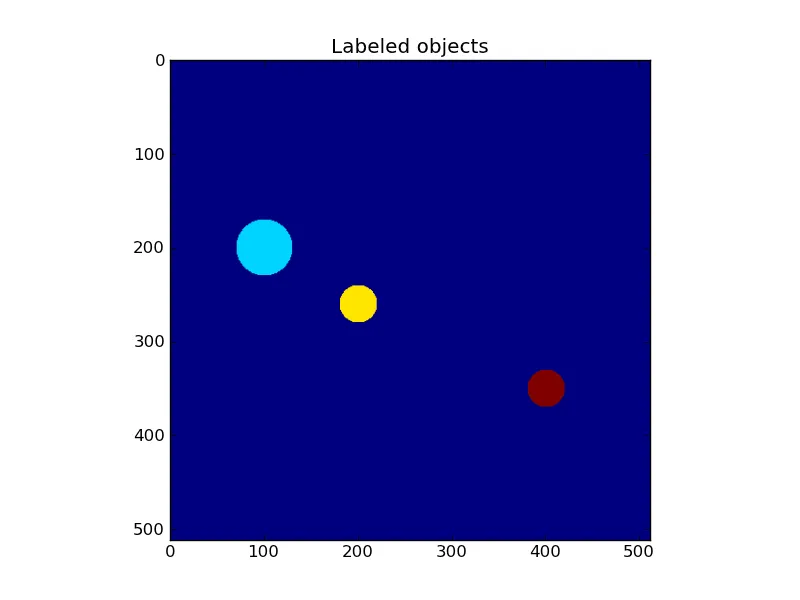
markers = np.zeros_like(a).astype(int16)
markers[0, 0] = 1
markers[200, 100] = 2
markers[350, 400] = 3
markers[260, 200] = 4
res = ndimage.watershed_ift(a.astype(uint8), markers)
unique(res)
B = argwhere(res.astype(uint8))
(ystart, xstart), (ystop, xstop) = B.min(0), B.max(0) + 1
tr = a[ystart:ystop, xstart:xstop]
print tr
接下来的步骤可能是找到形状周围的多边形路径,但现在先用边界框就好了!
请帮忙!
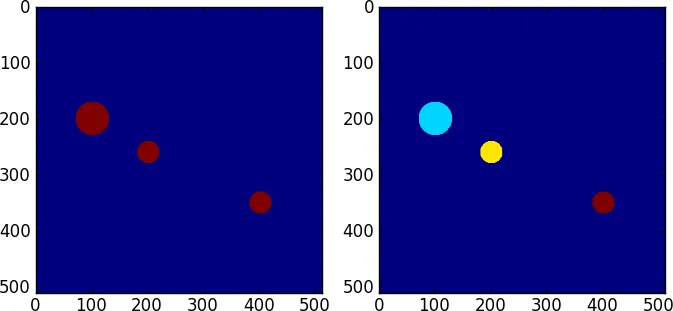
label == num,其中num是label(标记数组)中对象的数量。这样的操作在numpy数组上是向量化的,因此它就是上面的语句。你将得到一个布尔数组,在“对象”内部为True,在外部为False。 - Joe Kington