在 ggplot2 中制作分离轴图表

4
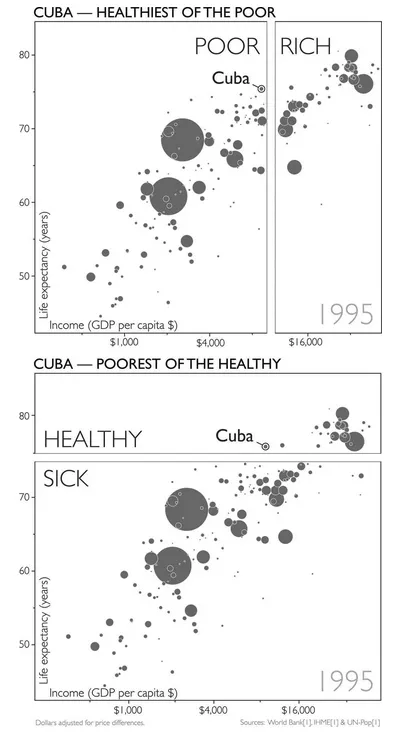
我在《事实的力量》(汉斯·罗斯林和他的孩子们所著的书)中发现了这个情节。我觉得这种分裂的美学相当吸引人。

enter image description here

虽然使用geom_rect()可以制作类似的东西,但外观会有很大不同。另一种方法是使用cowplotpatchwork,但这相当棘手。以下是我尝试复制顶部部分的进展情况:
gapminder %>% 
  filter(year==1997, gdpPercap<16000) %>%
  ggplot(aes(gdpPercap, y=lifeExp, size=pop)) +
  geom_point(alpha=0.5)+
  scale_x_log10()+
  ggthemes::theme_base()+
  theme(legend.position = "none",
        plot.background = element_blank(),
        plot.margin = unit(c(0.5, 0, 0, 0), "cm")) -> P1

gapminder %>% 
  filter(year==1997, gdpPercap>16000) %>%
  ggplot(aes(gdpPercap, y=lifeExp, size=pop)) +
  geom_point(alpha=0.5)+
  scale_x_log10()+
  ggthemes::theme_base()+
  theme(legend.position = "none",
        axis.title.y = element_blank(),
        axis.ticks.y = element_blank(),
        axis.text.y = element_blank(),
        plot.background = element_blank(),
        plot.margin = unit(c(0.5, 0.5, 0, 0), "cm"),
        axis.title.x = element_blank()) -> P2

cowplot::plot_grid(P1, P2, rel_widths = c(2,1), labels = NULL,
                   align = "h")

enter image description here

我认为所有的文本和高亮部分都可以使用现有的软件包实现。我想知道如何获得一个共同的x轴(右侧应显示根据刻度线)。理想情况下,x轴标题应居中,但这可能要求过高。我也可以将它作为文本移动到内部。
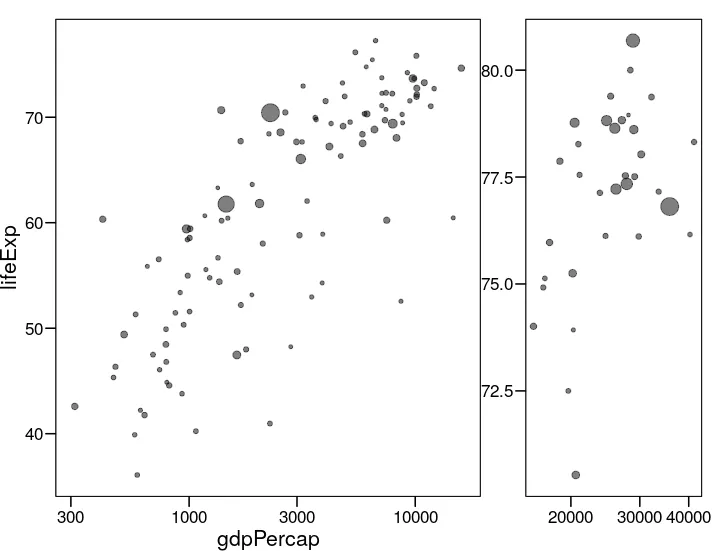
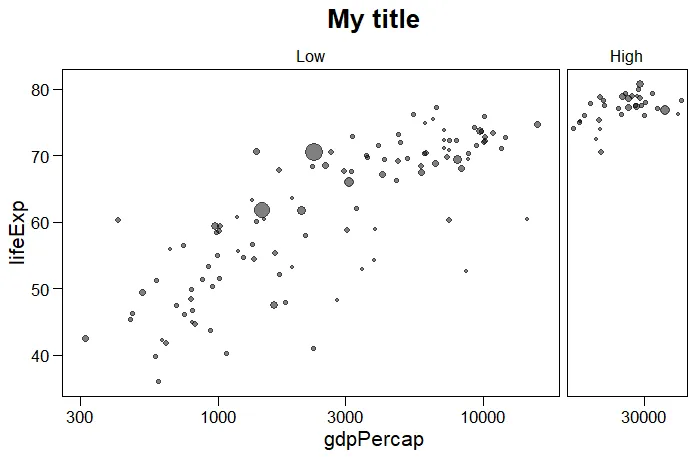
有轴的问题,就像您在具有y刻度的图中看到的那样。我想知道是否使用facets会是更好的方法。我也不确定点大小是否计算错误,因为我先筛选数据。
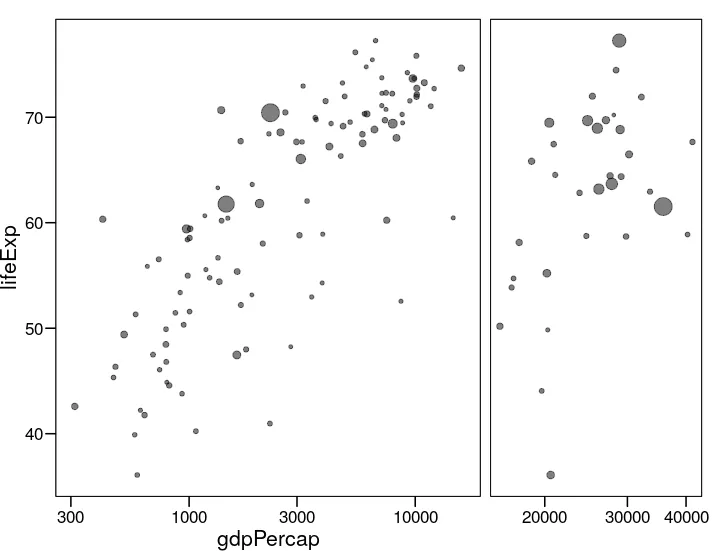
enter image description here

1个回答

4

以下是使用facets解决方案。您可以使用scale包的log10断点计算器预先计算断点来解决x轴断点问题。您可以在管道中使用mutate()创建一个新变量来拆分facets。

library(tidyverse)
library(gapminder)

breaks <- scales::log10_trans()$breaks(range(gapminder$gdpPercap), n = 6)

gapminder %>% 
  filter(year==1997) %>%
  mutate(facet = factor(ifelse(gdpPercap > 16000, "High", "Low"),
                        levels = c("Low", "High"))) %>%
  ggplot(aes(gdpPercap, y=lifeExp, size=pop)) +
  geom_point(alpha=0.5)+
  scale_x_log10(breaks = breaks)+
  ggthemes::theme_base()+
  facet_grid(~ facet, 
             scales = "free_x", space = "free_x") +
  ggtitle("My title") +
  theme(legend.position = "none",
        plot.title = element_text(hjust = 0.5),
        plot.background = element_blank())

enter image description here


这是一个不错的方法,实际上更直接的方式是将其放入一个函数中,该函数为您计算断点并正确分区数据绘图(这是我的最终意图)。 - Matias Andina

网页内容由stack overflow 提供, 点击上面的
可以查看英文原文,
原文链接