我有一组数据,使用seaborn库绘制直方图,应用核密度估计并对数据拟合正态分布。 但是我想从最佳拟合的正态分布中提取平均值和标准偏差。 我如何从此库的distplot函数中获得这些值作为输出?
import seaborn as sns
from scipy.stats import norm
sns.set_style("darkgrid")
sns.set_context("paper", font_scale=1, rc={"lines.linewidth": 1.5, "axes.linewidth": 1.0, "axes.labelsize": 15, "xtick.labelsize": 10, "ytick.labelsize": 10, "font.family":'serif','font.serif':'Ubuntu'})

fig, axes = plt.subplots(1, 1, figsize=(10, 10))
sns.distplot(C,
            fit=norm, kde=True,
            fit_kws ={"color": "#fc4f30", "lw": 1.5},
            kde_kws={"color": "y", "lw": 1.5},
            hist_kws={"histtype": "stepfilled", "linewidth": 1, "alpha": 0.1, "color": "b"},
            norm_hist=True, ax=axes[0,0])
seaborn库中的一个错误是,它不能为拟合的正态分布生成标签,但可以为直方图或核密度生成标签。
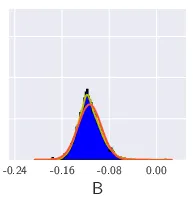
我该如何获取正态分布参数并在图表中添加标签?