由于regplot在间隔中计算平均值并引导查找每个箱的置信区间,因此需要手动重新计算这些值以进行进一步研究似乎是一种浪费,因此:
问题: 如何访问regplot的计算平均值和置信区间?
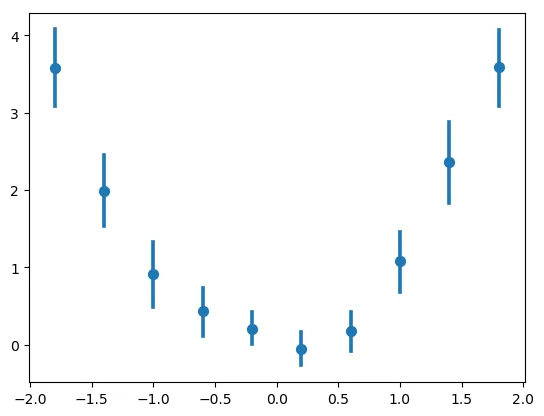
示例: 此代码生成一个漂亮的图形,显示有置信区间的箱平均值:
import numpy as np
import seaborn as sns
import matplotlib.pyplot as plt

# just some random numbers to get started
fig, ax = plt.subplots()
x = np.random.uniform(-2, 2, 1000)
y = np.random.normal(x**2, np.abs(x) + 1)

# Manual binning to retain control
binwidth=4./10
x_bins=np.arange(-2+binwidth/2,2,binwidth)
sns.regplot(x=x, y=y, x_bins=x_bins, fit_reg=None)
plt.show()
结果: 展示带置信区间的分组数据的回归图
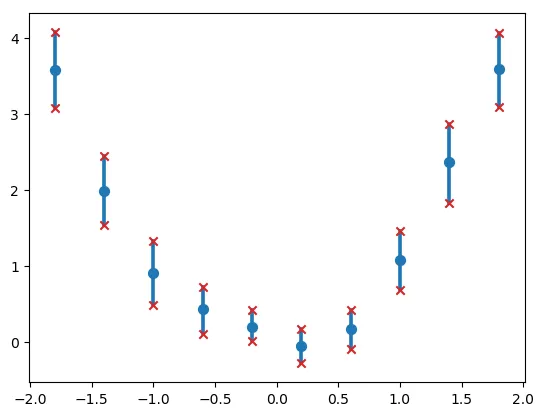
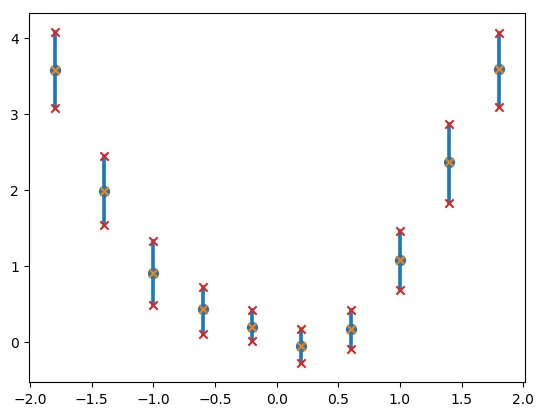
按照分组计算均值并不难,但置信区间是使用随机数计算的。能否让我访问与绘制相同的确切数字会很好,那么我该如何访问它们呢?我可能忽略了一些 get_*-方法。