我有一些不同x点处函数的值。我想在Python中绘制均值和标准差,就像这个SO问题的答案那样。我知道使用matplotlib一定很容易,但是我不知道可以做到这一点的函数名称。有人知道吗?
我有一些不同x点处函数的值。我想在Python中绘制均值和标准差,就像这个SO问题的答案那样。我知道使用matplotlib一定很容易,但是我不知道可以做到这一点的函数名称。有人知道吗?
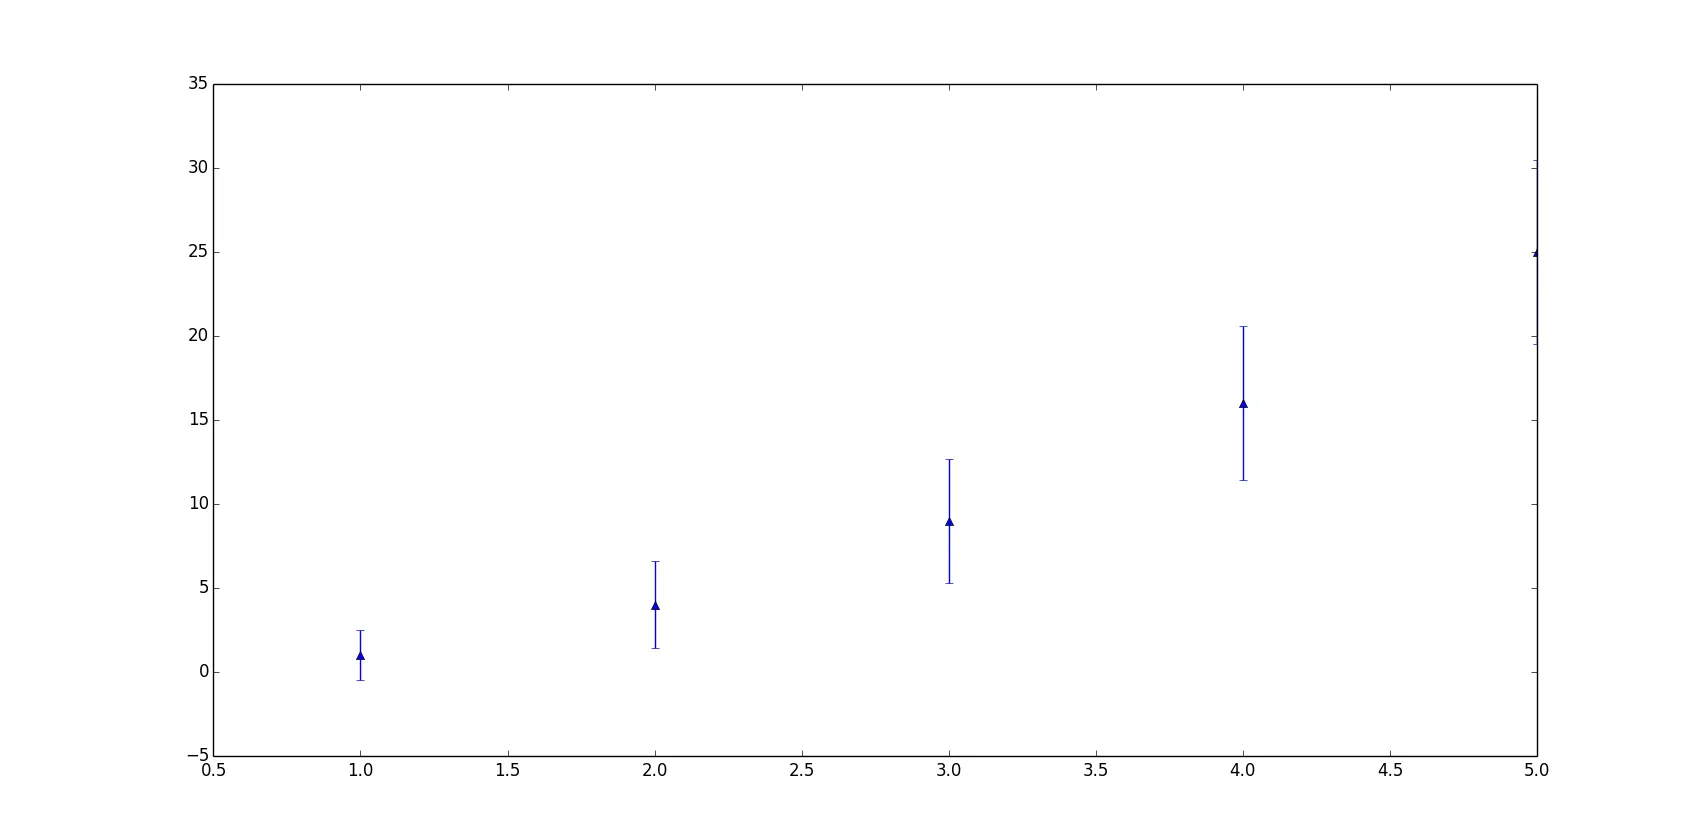
plt.errorbar可用于绘制x、y、误差数据(与通常的plt.plot不同)
import matplotlib.pyplot as plt
import numpy as np

x = np.array([1, 2, 3, 4, 5])
y = np.power(x, 2) # Effectively y = x**2
e = np.array([1.5, 2.6, 3.7, 4.6, 5.5])

plt.errorbar(x, y, e, linestyle='None', marker='^')

plt.show()
plt.errorbar接受与plt.plot相同的参数,还包括额外的yerr和xerr,默认为None(即如果您将它们留空,它将像plt.plot一样操作)。
你可以通过这个例子找到答案:errorbar_demo_features.py
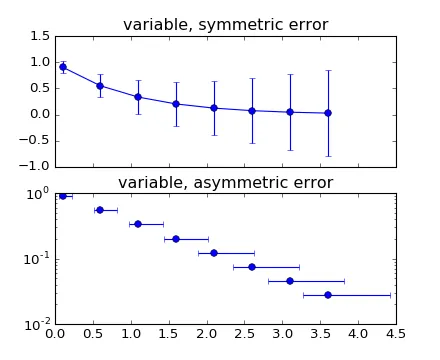
"""
Demo of errorbar function with different ways of specifying error bars.

Errors can be specified as a constant value (as shown in `errorbar_demo.py`),
or as demonstrated in this example, they can be specified by an N x 1 or 2 x N,
where N is the number of data points.

N x 1:
    Error varies for each point, but the error values are symmetric (i.e. the
    lower and upper values are equal).

2 x N:
    Error varies for each point, and the lower and upper limits (in that order)
    are different (asymmetric case)

In addition, this example demonstrates how to use log scale with errorbar.
"""
import numpy as np
import matplotlib.pyplot as plt

# example data
x = np.arange(0.1, 4, 0.5)
y = np.exp(-x)
# example error bar values that vary with x-position
error = 0.1 + 0.2 * x
# error bar values w/ different -/+ errors
lower_error = 0.4 * error
upper_error = error
asymmetric_error = [lower_error, upper_error]

fig, (ax0, ax1) = plt.subplots(nrows=2, sharex=True)
ax0.errorbar(x, y, yerr=error, fmt='-o')
ax0.set_title('variable, symmetric error')

ax1.errorbar(x, y, xerr=asymmetric_error, fmt='o')
ax1.set_title('variable, asymmetric error')
ax1.set_yscale('log')
plt.show()
它绘制了这个图表: