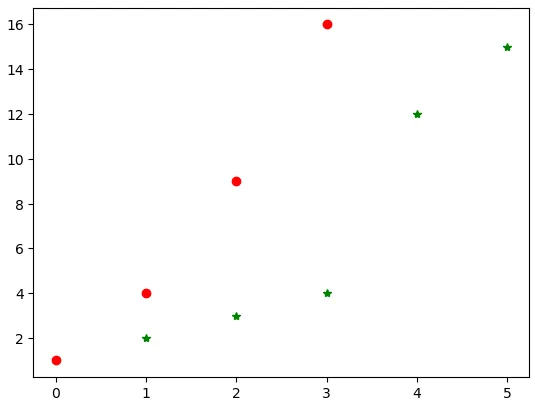
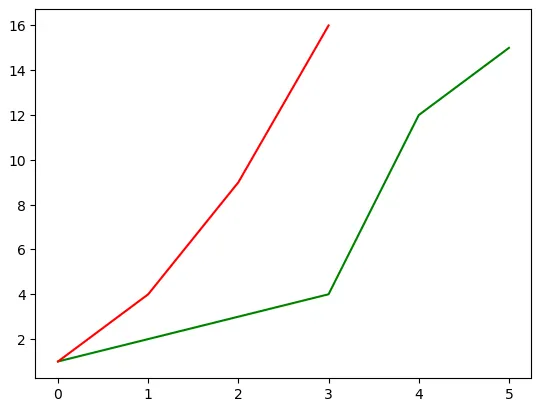
我需要在同一张图上绘制两个列表,线条颜色应该不同。
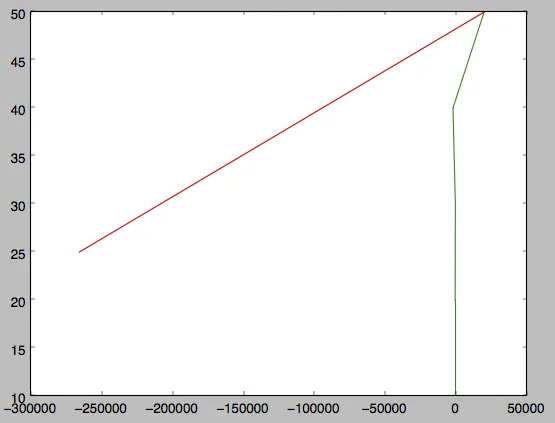
我正在尝试在同一张图上绘制forecast和train_Z,但是它们被绘制成相互对立的形式,forecast在x轴上,train_Z在y轴上。
这是我尝试过的代码:
import matplotlib.pyplot as plt
train_X = [1,2,3,4,5]
train_Y = [10, 20, 30, 40, 50]
train_Z = [10, 20, 30, 40, 50,25]
alpha = float(input("Input alpha: "))
forecast = []
for x in range(0, len(train_X)+1):
if x==0:
forecast.append(train_Y[0])
else:
forecast.append(alpha*train_Y[x-1] + (1 - alpha) * forecast[x-1])
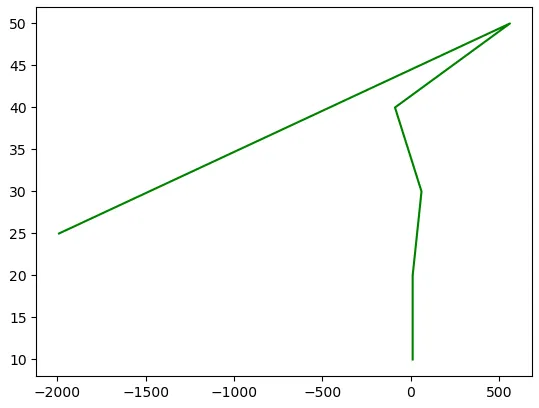
plt.plot(forecast,train_Z,'g')
plt.show()
使用 alpha == 5