另外,您还可以使用 curve_fit,如果您有不止两个数据点,则可能会很方便。输出如下:
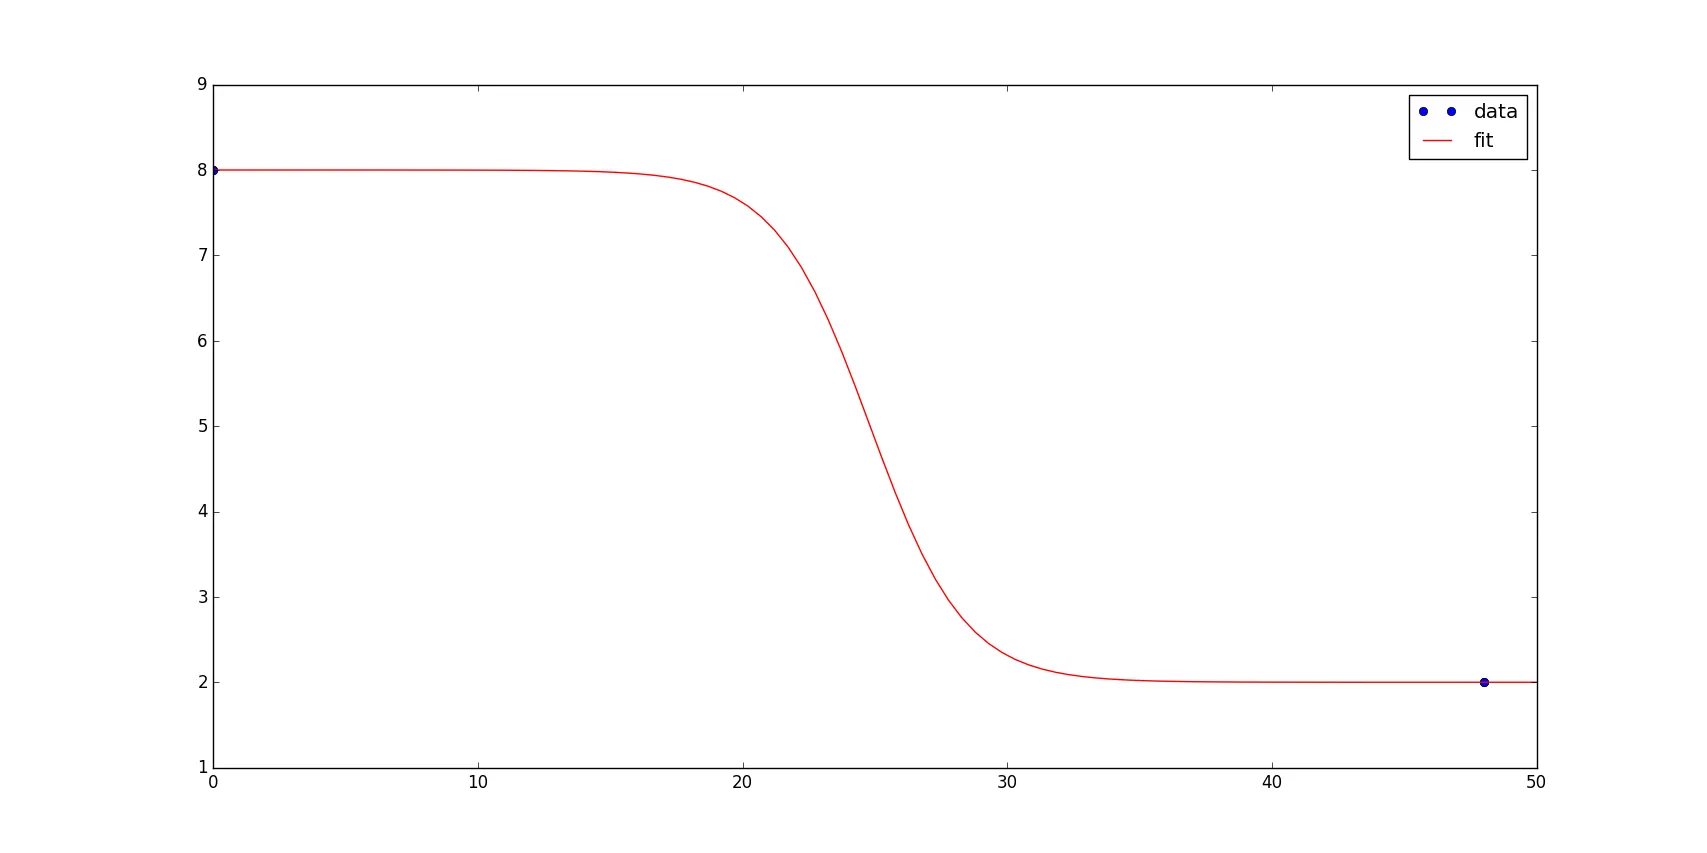
正如您所看到的,图表包含所需的数据点。我使用了@lanery的函数进行拟合;当然,您可以选择任何您喜欢的函数。这是带有一些内联注释的代码:
import numpy as np
import matplotlib.pyplot as plt
from scipy.optimize import curve_fit
def sigmoid(x, a, b, c, d):
return ((a - b) / (1. + np.exp(x - (c / 2)) ** d)) + b
xdata = [0., 48.] * 2
ydata = [8., 2.] * 2
plt.plot(xdata, ydata, 'bo', label='data')
popt, pcov = curve_fit(sigmoid, xdata, ydata, p0=[1., 1., 50., 0.5])
xdata_new = np.linspace(0, 50, 100)
plt.plot(xdata_new, sigmoid(xdata_new, *popt), 'r-', label='fit')
plt.legend(loc='best')
plt.show()
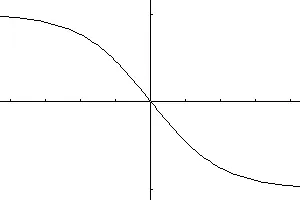
atan和atanh是常用的Sigmoid函数。 - f5r5e5d