[编辑] 感谢 Александр Рах马耶夫
自版本3.3.3以来,默认情况下在pcolormesh中使用shading=flat会导致当前数据出错。我正在使用shading=closest。然后就不会出错了。例如:plt.pcolormesh(th, r, z, shading='nearest')也可参见此处
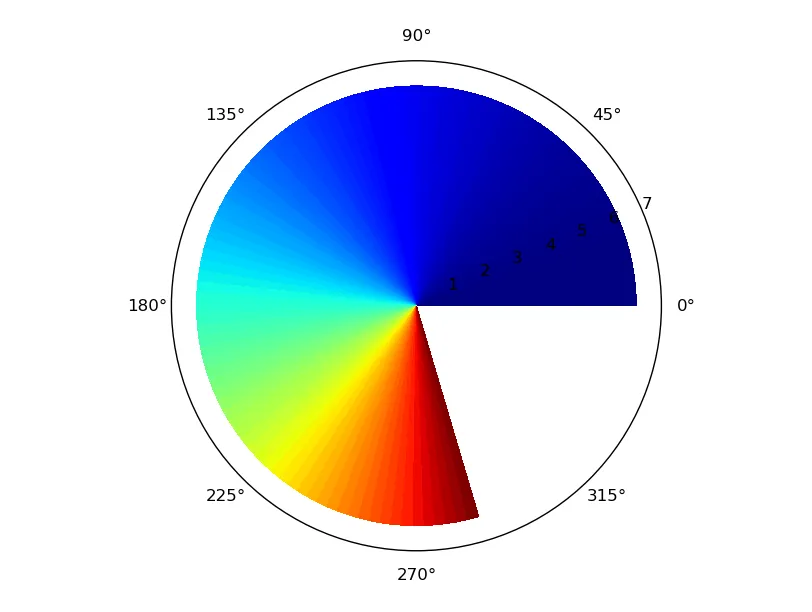
我认为您不小心混淆了radius、zenith和azimuth :)
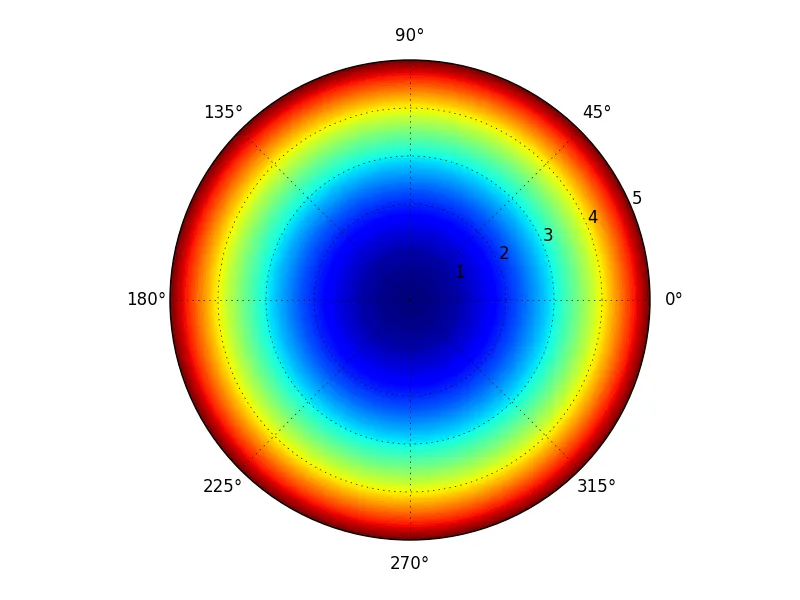
这将绘制我认为您想要的内容:
import matplotlib.pyplot as plt
from mpl_toolkits.mplot3d import Axes3D
import numpy as np
fig = plt.figure()
ax = Axes3D(fig)
rad = np.linspace(0, 5, 100)
azm = np.linspace(0, 2 * np.pi, 100)
r, th = np.meshgrid(rad, azm)
z = (r ** 2.0) / 4.0
plt.subplot(projection="polar")
plt.pcolormesh(th, r, z)
plt.plot(azm, r, color='k', ls='none')
plt.grid()
plt.show()
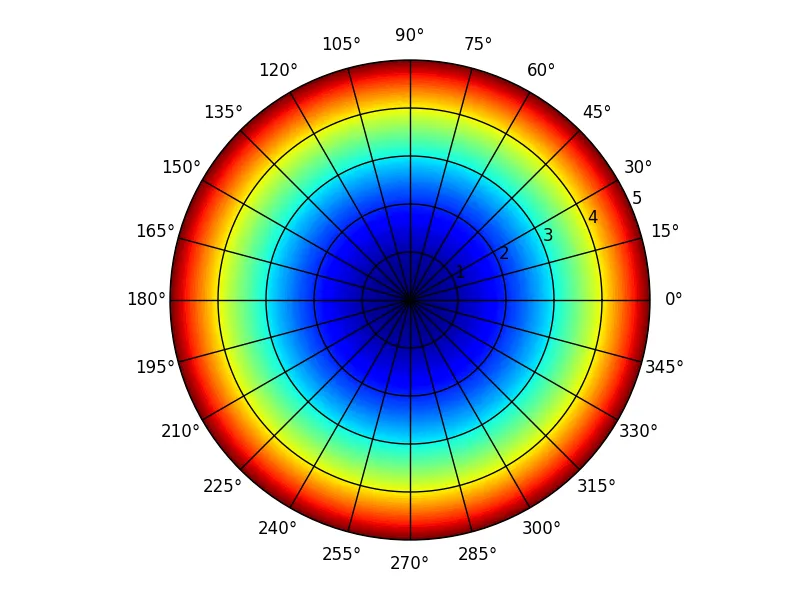
如果你想要射线网格线,你可以按照以下方法在每个Theta位置添加它们:
plt.thetagrids([theta * 15 for theta in range(360//15)])
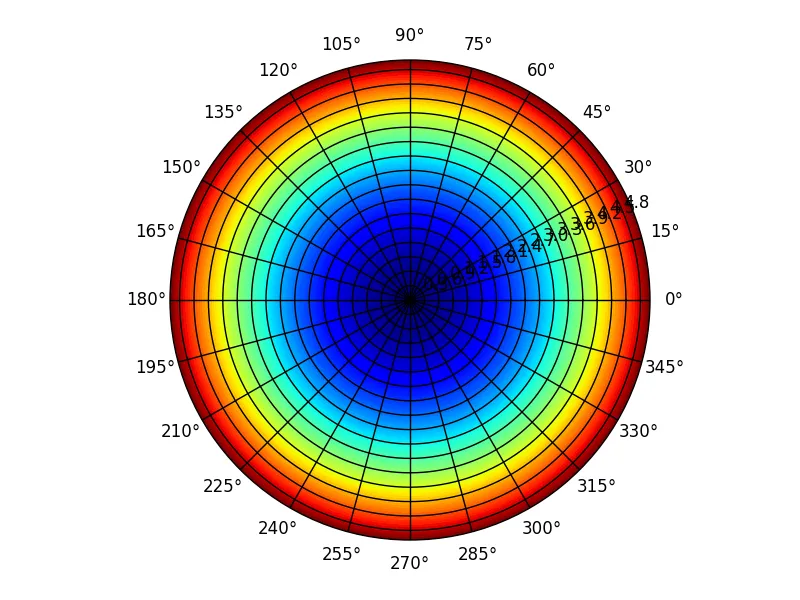
还有更多类似这样的径向网格:
plt.rgrids([.3 * _ for _ in range(1, 17)])
PS:numpy和pyplot可使您的名称空间保持整洁...
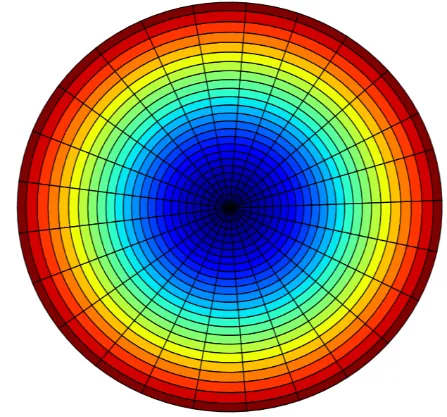
plt.pcolormesh(th, r, z, shading='nearest')另请参见https://matplotlib.org/3.3.0/gallery/images_contours_and_fields/pcolormesh_grids.html。 - Alexander Rakhmaev