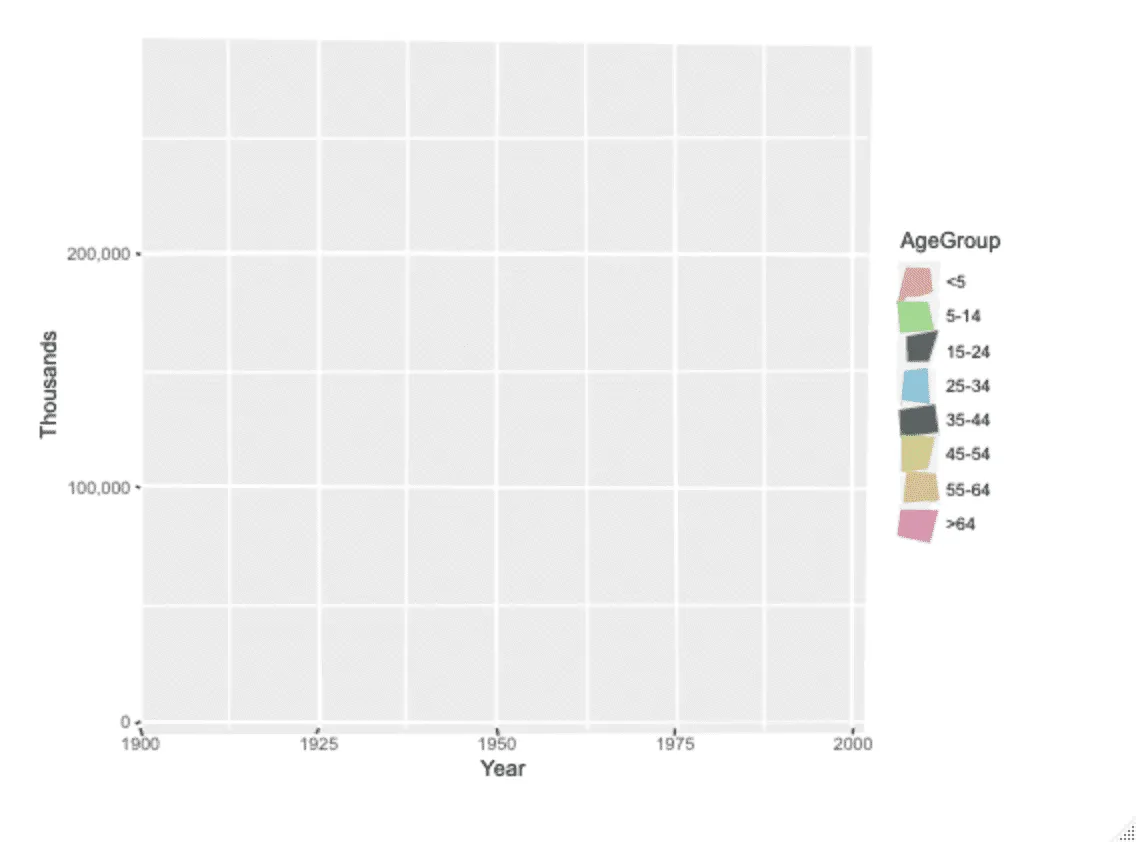
由于ggrough包寻找名为“polyline”的xml节点来查找目标区域,因此该包无法与当前版本的ggplot2很好地配合使用geom_area。在较旧的ggplot2版本中,这可能效果很好,因为每个区域都被折线包围。然而,在更近期的版本中,情况却不再如此(请参见3.3.0版本下的重大变更)。
如果下面的方法适用于您,请尝试:
- 定义一个版本的
parse_*函数,该函数寻找“polygon”而不是“polyline”。
parse_polygons <- function (svg) {
shape <- "polygon"
keys <- NULL
ggrough:::parse_shape(svg, shape, keys) %>% {
purrr::map(.,
~purrr::list_modify(.x,
points = stringr::str_squish(.x$points) %>%
{stringr::str_glue("M{.}Z")},
shape = "path"))
}
}
- 在ggrough中更改相应的未导出函数,以使用新定义的
parse_polygons用于GeomArea层。
此外,我添加了GeomRibbon(原始版本似乎缺少,但实际上是GeomArea的更一般情况),并将GeomViolin从parse_areas移至parse_polygons,因为它面临相同的问题。
(注意:GeomSmooth也可能会失败,但我认为与GeomRibbon / GeomViolin相比,它的解析函数需要进行更多调整,而且我没有看到其使用案例...)
trace(ggrough:::parse_rough, edit = TRUE)
function (svg, geom) {
rough_els <- list()
if (geom %in% c("GeomCol", "GeomBar", "GeomTile", "Background")) {
rough_els <- append(rough_els, parse_rects(svg))
}
if (geom %in% c("GeomSmooth", "Background")) {
rough_els <- append(rough_els, parse_areas(svg))
}
if (geom %in% c("GeomArea", "GeomRibbon", "GeomViolin")) {
rough_els <- append(rough_els, parse_polygons(svg))
}
if (geom %in% c("GeomPoint", "GeomJitter", "GeomDotPlot", "Background")) {
rough_els <- append(rough_els, parse_circles(svg))
}
if (geom %in% c("GeomLine", "GeomSmooth", "Background")) {
rough_els <- append(rough_els, parse_lines(svg))
}
if (geom %in% c("Background")) {
rough_els <- append(rough_els, parse_texts(svg))
}
purrr::map(rough_els, ~purrr::list_modify(.x, geom = geom))
}
测试:
library(ggplot2)
library(ggrough)
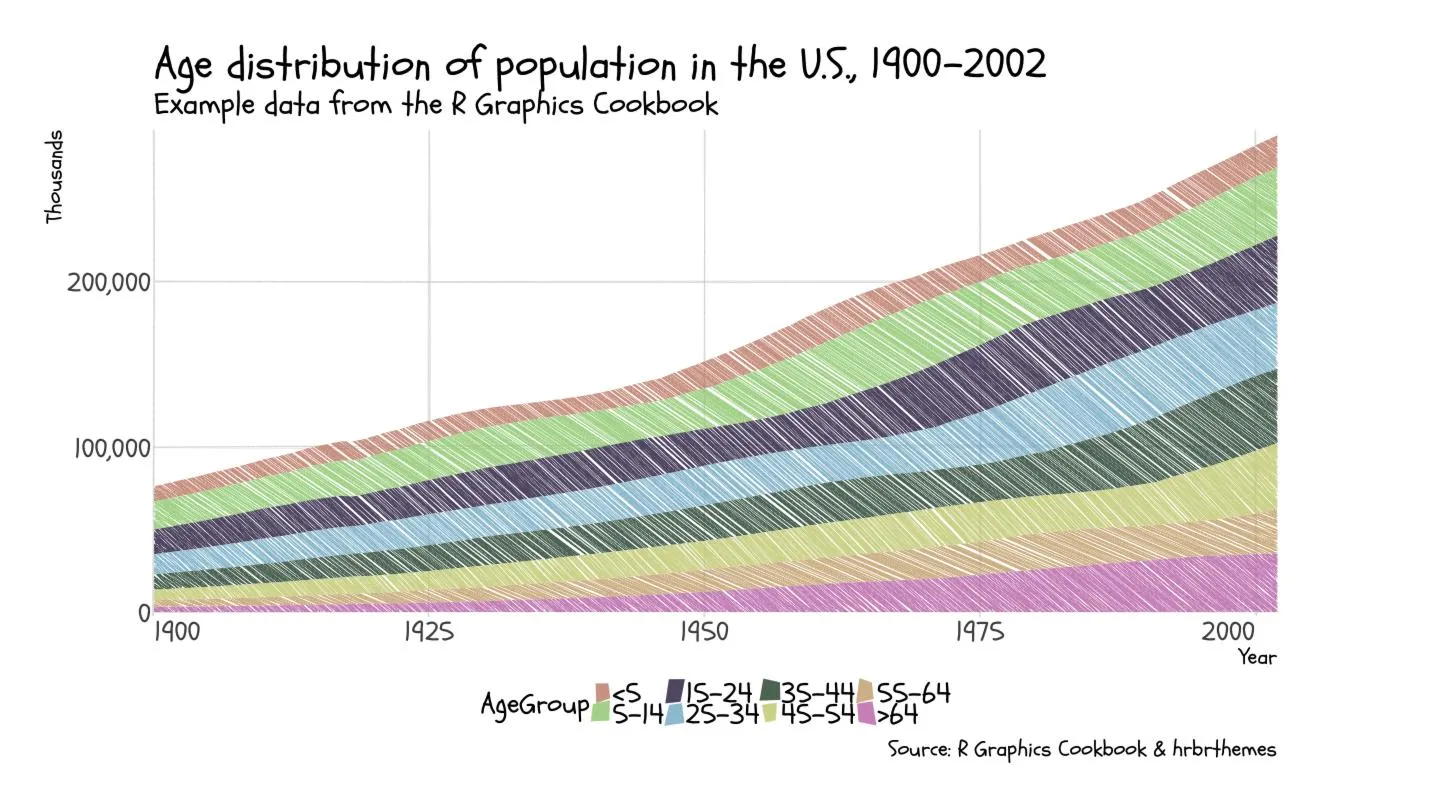
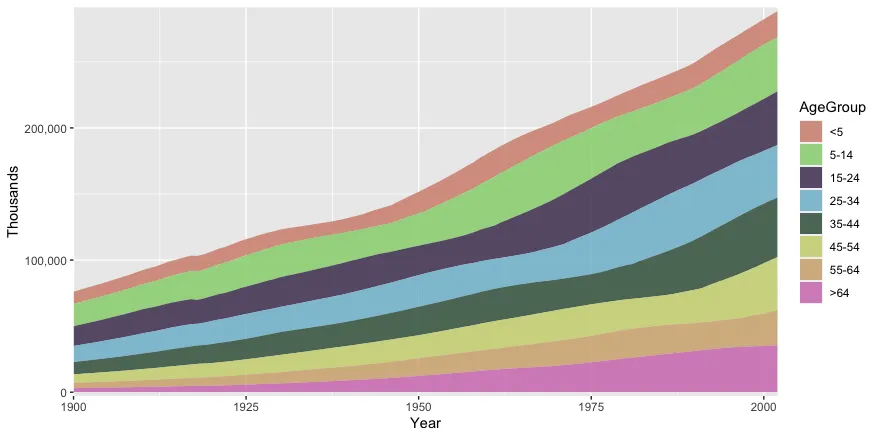
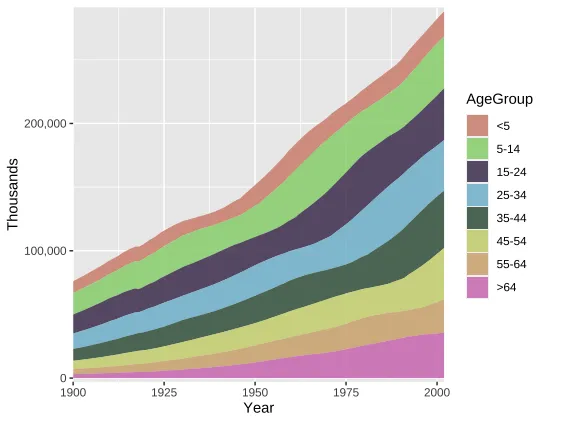
uspopage <- gcookbook::uspopage
p <- ggplot(uspopage, aes(x=Year, y=Thousands, fill=AgeGroup)) +
geom_area(alpha=0.8) +
scale_x_continuous(expand=c(0,0)); p
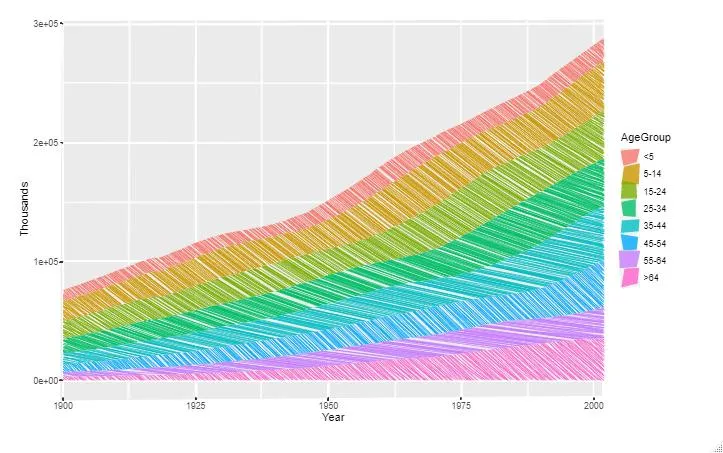
options <- list(GeomArea=list(fill_style="hachure",
angle_noise=0.5,
gap_noise=0.2,
gap=1.5,
fill_weight=1))
get_rough_chart(p, options)
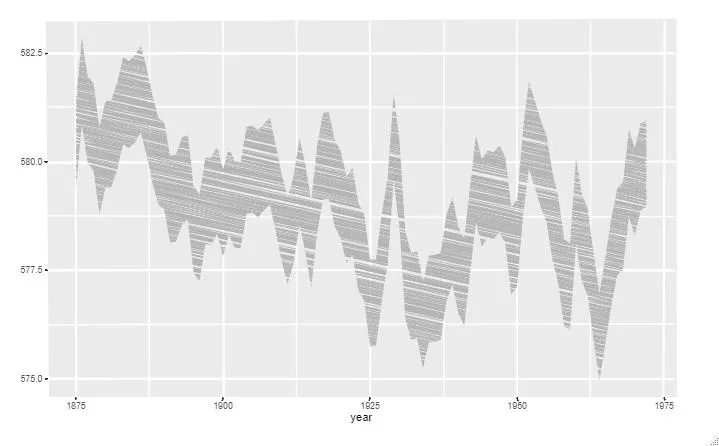
geom_ribbon 的附加测试:
pp <- data.frame(year = 1875:1972, level = as.vector(LakeHuron)) %>%
ggplot(aes(year)) +
geom_ribbon(aes(ymin = level - 1, ymax = level + 1),
fill = "grey70")
options <- list(GeomRibbon=list(fill_style="hachure",
angle_noise=0.5,
gap_noise=0.2,
gap=1.5,
fill_weight=1))
get_rough_chart(pp, options)
会话信息:
R version 4.0.1 (2020-06-06)
Platform: x86_64-w64-mingw32/x64 (64-bit)
Running under: Windows 10 x64 (build 15063)

Matrix products: default

locale:
[1] LC_COLLATE=English_Singapore.1252  LC_CTYPE=English_Singapore.1252
[3] LC_MONETARY=English_Singapore.1252 LC_NUMERIC=C
[5] LC_TIME=English_Singapore.1252

attached base packages:
[1] stats     graphics  grDevices utils     datasets  methods   base

other attached packages:
[1] gdtools_0.2.2 dplyr_1.0.0   ggrough_0.1.0 ggplot2_3.3.2

loaded via a namespace (and not attached):
 [1] Rcpp_1.0.5        cpp11_0.2.1       pillar_1.4.6      compiler_4.0.1
 [5] plyr_1.8.6        Rmisc_1.5         forcats_0.5.0     tools_4.0.1
 [9] boot_1.3-25       digest_0.6.25     jsonlite_1.7.1    lifecycle_0.2.0
[13] tibble_3.0.3      gtable_0.3.0      lattice_0.20-41   pkgconfig_2.0.3
[17] rlang_0.4.7       rstudioapi_0.11   yaml_2.2.1        xml2_1.3.2
[21] withr_2.2.0       stringr_1.4.0     htmlwidgets_1.5.1 systemfonts_0.3.1
[25] generics_0.0.2    vctrs_0.3.4       grid_4.0.1        tidyselect_1.1.0
[29] data.table_1.12.8 svglite_1.2.3.2   glue_1.4.2        R6_2.4.1
[33] gcookbook_2.0     tidyr_1.1.0       reshape2_1.4.4    purrr_0.3.4
[37] farver_2.0.3      magrittr_1.5      htmltools_0.5.0   scales_1.1.1
[41] ellipsis_0.3.1    fortunes_1.5-4    colorspace_1.4-1  labeling_0.3
[45] stringi_1.5.3     munsell_0.5.0     crayon_1.3.4