目前,我在Rails 5上使用chart.js创建了一个柱状图,它通过对比两个结果并将它们放在一起展示。如第一张图片所示。
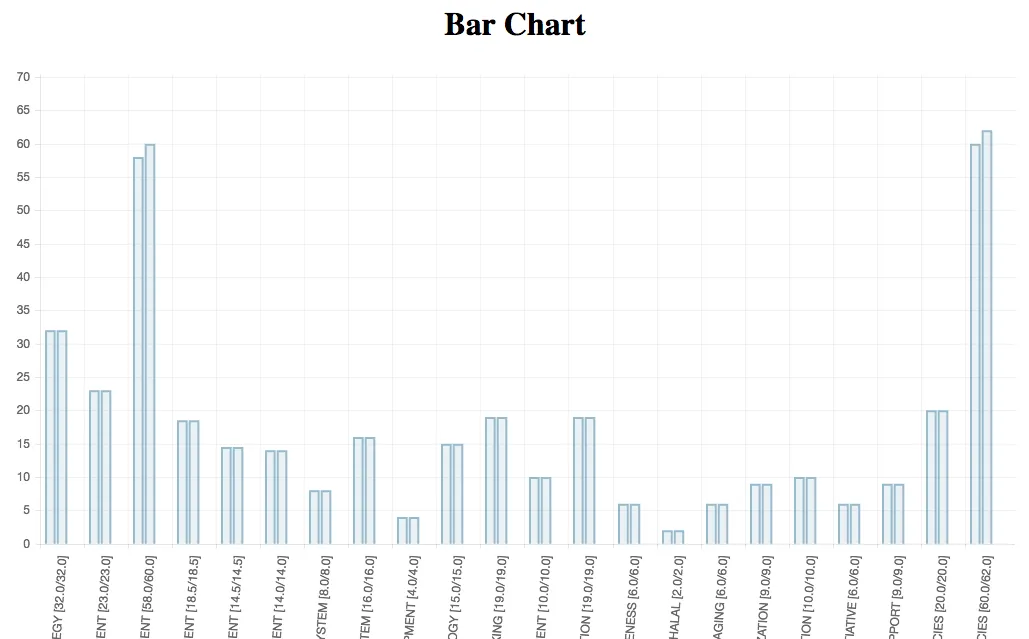
它显示了左边的柱子的当前得分和右边柱子的总分。
但是,我收到了这样的请求:要将这些柱状图合并,并显示当前得分和总得分的图例。
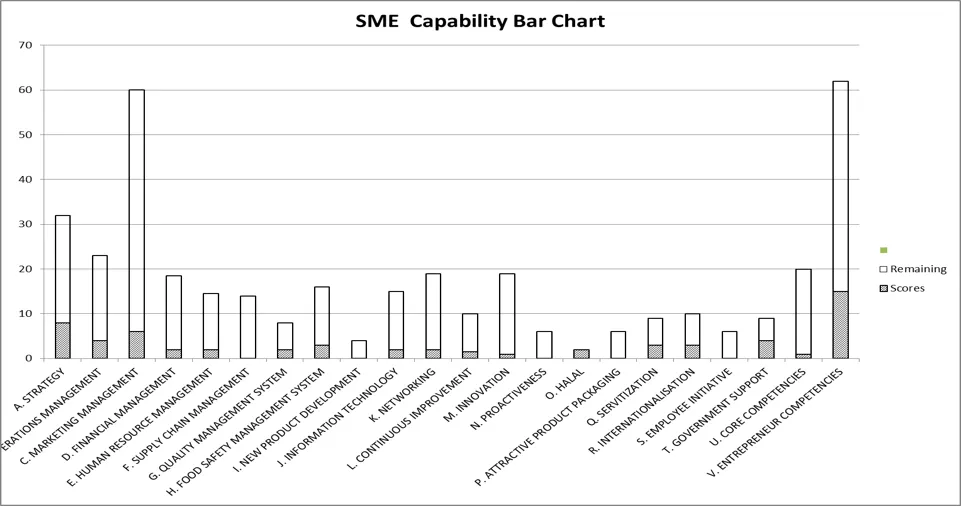
我已经搜索过了,但只发现了堆叠柱状图。是否有可能将两个柱子合并在一起呢?
目前,我在Rails 5上使用chart.js创建了一个柱状图,它通过对比两个结果并将它们放在一起展示。如第一张图片所示。
它显示了左边的柱子的当前得分和右边柱子的总分。
但是,我收到了这样的请求:要将这些柱状图合并,并显示当前得分和总得分的图例。
我已经搜索过了,但只发现了堆叠柱状图。是否有可能将两个柱子合并在一起呢?
我已经找到了解决方案。对于Chart.js 2.1.x及以上版本(在Chart.js 1.x.x中不起作用),您可以按照下面所示的自定义选项应用数据集:
var options = {
  scales:{
    xAxes: [{ stacked: true }],
    yAxes: [{ stacked: true }]
  }
};

var myBarChart = new Chart(ctx, {
  type: 'bar',
  data: data,
  options: options
});
我正在使用来自此源的chart js 2.2.1 gem。第3到35行的帮助方法提供了创建堆叠条形图的见解。但是它没有选项来输入给定方法中的数据。因此,让我们覆盖帮助方法:
  def chart2_bar id=nil, size=nil, data={}, options={}
    html = "<canvas id=\"myChart_bar\" width=\"#{size[:width]}px\" height=\"#{size[:height]}px\"></canvas>".html_safe
    script = javascript_tag do
      <<-END.html_safe
      var ctx = document.getElementById("myChart_bar");
      var data = "#{data.to_json}";
      var options = "#{options.to_json}";
      var myBarChart = new Chart(ctx, {
        type: 'bar',
        data: data,
        options: options
      });
      END
    end
    return html + script
  end