我希望在ggvis图中获得x轴的完整数字。
最小工作示例(MWE)
df <-
  structure(list(Factor = structure(c(1L, 2L, 3L, 1L, 2L, 3L, 1L,
  2L, 3L, 1L, 2L, 3L), .Label = c("A", "B", "C"), class = "factor"),
  X = c(15.5133333333333, 14.63, 14.41, 14.1266666666667, 13.1833333333333,
  12.9466666666667, 13.6133333333333, 13.55, 13.5333333333333,
  11.5566666666667, 11.3066666666667, 11.4566666666667), Y = c(20L,
  20L, 20L, 40L, 40L, 40L, 70L, 70L, 70L, 100L, 100L, 100L)), .Names = c("Factor",
  "X", "Y"), row.names = c(NA, -12L), class = "data.frame")

library(ggvis)

ggvis(data=df
      , x= ~X
      , y= ~Y
      , fill= ~Factor
      , stroke = ~Factor) %>%
  arrange(Y) %>%
  group_by(Factor) %>%
  layer_points(shape=~Factor) %>%
  layer_paths(fill := NA)  %>%
  add_axis('x', orient=c('bottom'), format='####')
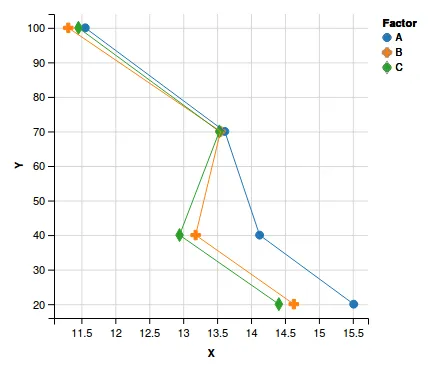
一种可能的方法是在add_axis()中使用values=seq(from=10, to=16, by=1)。但这种方法并不是自动化的。
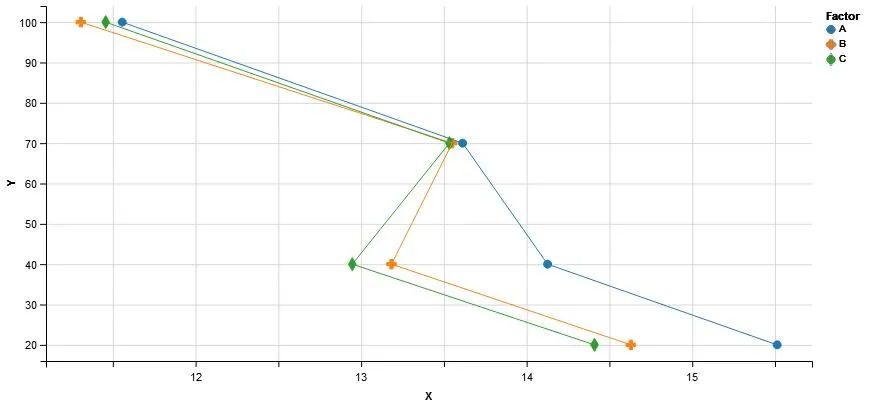
seq(min(floor(df$X)),max(ceiling(df$X)),by=1)。 - LyzandeRadd_axis('x', orient=c('bottom'), format='d')将仅使用整数值标签,即删除中间标签 - 这是d3参考资料。 - nrussellforamt='d'是我需要的ggvis图形。nrussell,您能否将您的评论更改为答案,以便我可以接受它。谢谢。 - MYaseen208