我用以下脚本生成了这个图表。 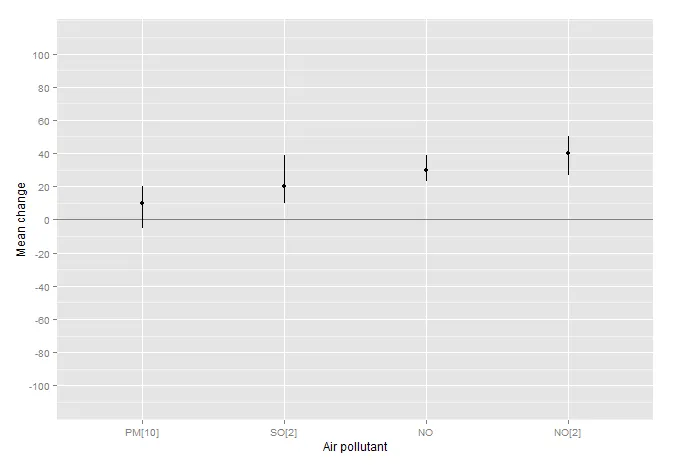 但是,我该如何将PM10中的“10”、SO2中的“2”和NO2中的“2”下标呢?
我尝试过levels(df$variable) <- c("PM[10]","SO[2]", "NO", "NO[2]"),但不起作用。
有人能帮忙吗?谢谢!
variable <- c("PM10","SO2","NO","NO2")
coef <- c(10,20,30,40)
coef_lb <- c(-5,10,23,27)
coef_ub <- c(20,39,39,50)

df <- as.data.frame(cbind(variable, as.numeric(coef),as.numeric(coef_lb),as.numeric(coef_ub)))


df$variable <- factor(df$variable,levels=c("PM10","SO2","NO","NO2"))
levels(df$variable) <- c("PM[10]","SO[2]", "NO", "NO[2]")

library(ggplot2)
#ggplot 95%CI
BWplot <- ggplot(data=df,aes(x=variable,y=coef))
BWplot <- BWplot + geom_pointrange(aes(ymin=coef_lb,ymax=coef_ub))
BWplot <- BWplot + geom_point()
BWplot <- BWplot + scale_y_continuous(limits=c(-110, 110),breaks=seq(-100, 100, by = 20))
BWplot <- BWplot + xlab("Air pollutant")
BWplot <- BWplot + ylab("Mean change")
BWplot <- BWplot + geom_hline(yintercept=0,alpha=0.5)
BWplot
labels = parse(text=levels(df$variable))来省略显式地描述每个标签。 - alexwhan