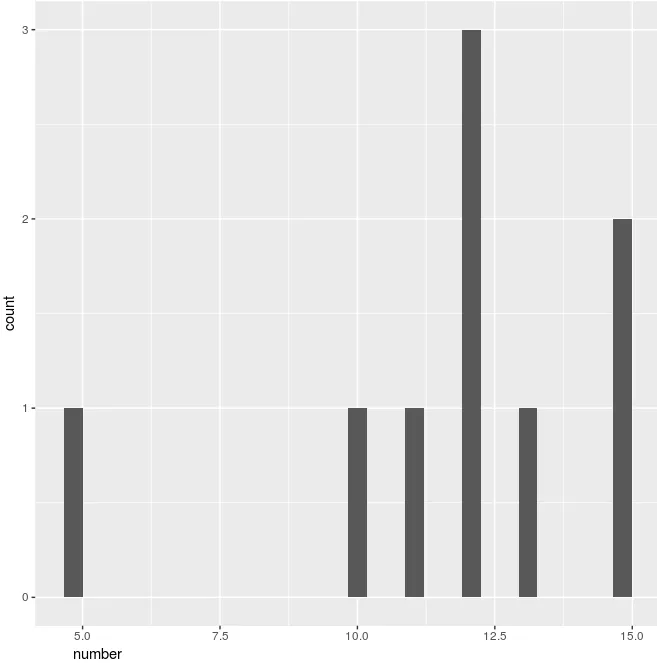
考虑以下示例:
library(ggplot2)
dat <- data.frame(number = c(5, 10, 11 ,12,12,12,13,15,15))
ggplot(dat, aes(x = number)) + geom_histogram()
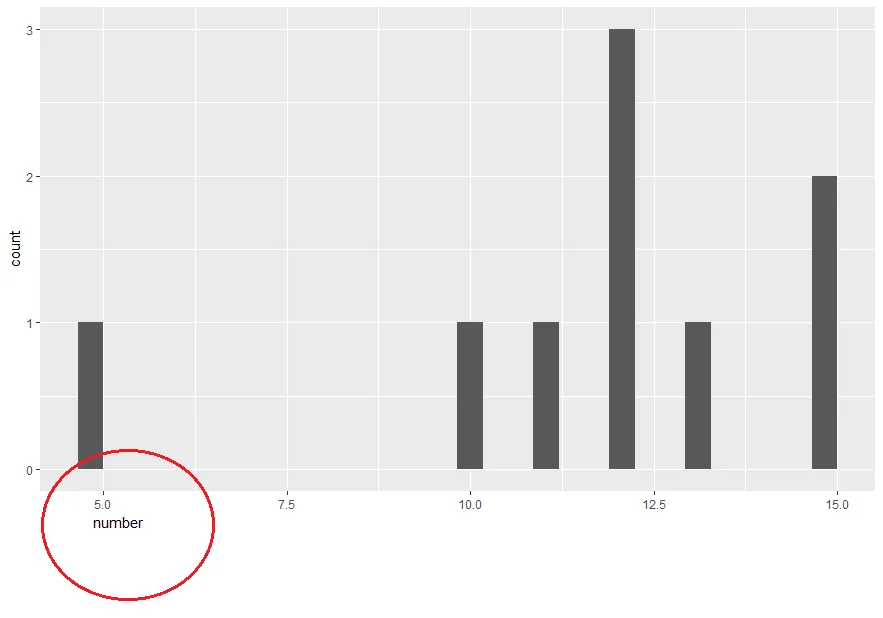
如何将X轴标签左对齐,以便与X轴第一个刻度的文本对齐?
结果应该如下图所示:
 我正在寻找一种可以轻松推广到其他绘图的解决方案。
创建绘图对象后,我们可以获取第一个刻度标签的位置。
p <- ggplot(dat, aes(x = number)) +
                      geom_histogram()

i1 <- ggplot_build(p)$layout$panel_ranges[[1]]$x.major[1]
#or
library(magrittr)
i1 <-  p %>%
          ggplot_build %>%
          extract2("layout") %>%
          extract2("panel_ranges") %>%
          extract2(1) %>%
          extract2("x.major") %>%
          extract(1)
然后在theme中使用它。更好的方法是查看并根据需要进行调整。
p +
   theme(axis.title.x = element_text(hjust = i1- 0.01))
theme(axis.title.x = element_text(hjust = 0))更具体的东西吗? - camille