如何在限制x轴范围的同时更改x轴刻度?

3
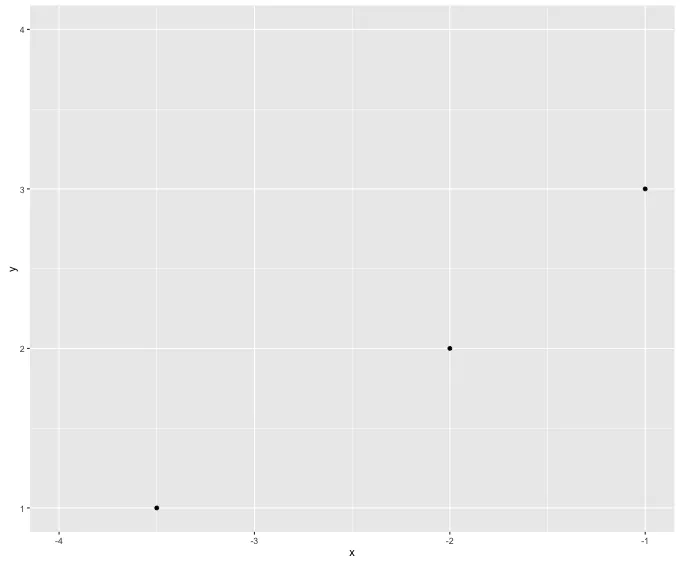
我有一个示例数据框,我想从-4,-1绘制它:
test_x <- c(-3.5, -2, -1, -0.5)
test_y <- c(1,2,3,4)
df <- data.frame(x=test_x, y=test_y)
library(ggplot2)
ggplot(df, aes(x=x, y=y)) + 
  geom_point() +
  xlim(-4, -1)

我想展示-4的刻度,同时排除-0.5的点。但是,我也想更改x轴的刻度标签。对于连续数据,我发现使用scale_x_continuous

enter image description here

ggplot(df, aes(x=x, y=y)) + 
  geom_point() +
  scale_x_continuous(breaks=c(-4, -3, -2, -1), labels=c("a","b","c","d"))

在此输入图片描述

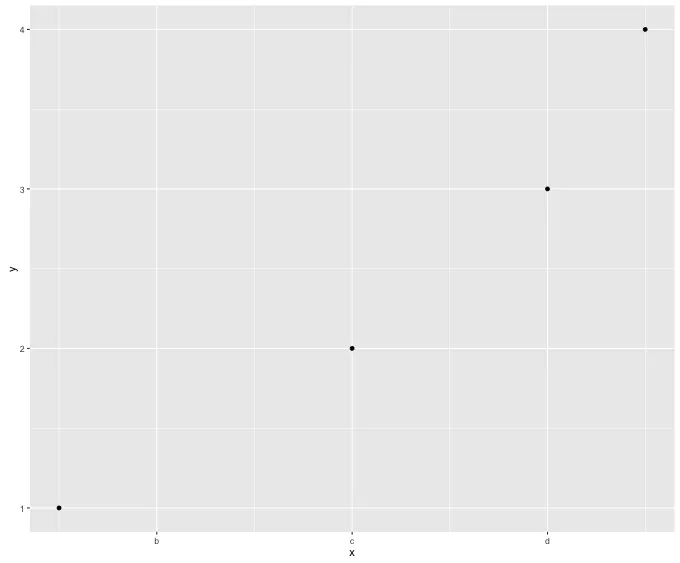
但是,这并没有显示a刻度,并且它也没有排除-0.5点。尝试使用x_lim再次限制会出现错误:Scale for 'x' is already present. Adding another scale for 'x', which will replace the existing scale

如何在仍然限制x轴范围的情况下更改x轴刻度?


1
为什么你想要这样做呢?如果x确实是连续的,用字母标记x值会使读者失去关于点之间距离的信息。 - undefined
1个回答

7

在比例尺内使用限制:

ggplot(df, aes(x = x, y = y)) + 
  geom_point() +
  scale_x_continuous(breaks = c(-4, -3, -2, -1),
                     labels = c("a", "b", "c", "d"),
                     limits = c(-4, -1))
注意,通过应用限制 c(-4, -1) ,我们将会丢掉一个点,因此会出现警告信息:

警告信息:已删除1行包含缺失值的数据 (geom_point)。


作为 limits 的替代方案,您还可以使用 coord_cartesian(xlim = c(-4, -1)),它不像设置限制那样改变底层数据(因此,您也不会收到有关已删除行的警告):
ggplot(df, aes(x=x, y=y)) + 
  geom_point() +
  scale_x_continuous(breaks = c(-4, -3, -2, -1),
                     labels = c("a", "b", "c", "d")) +
  coord_cartesian(xlim = c(-4, -1))

网页内容由stack overflow 提供, 点击上面的
可以查看英文原文,
原文链接