为什么plt.imshow()不显示图像?

111

我有这段代码,是从教程上复制的:

import numpy as np
np.random.seed(123)
from keras.models import Sequential
from keras.layers import Dense, Dropout, Activation, Flatten
from keras.layers import Convolution2D, MaxPooling2D
from keras.utils import np_utils
from keras.datasets import mnist
(X_train,y_train),(X_test,y_test) = mnist.load_data()
print X_train.shape
from matplotlib import pyplot as plt
plt.imshow(X_train[0])

没有显示任何图像。为什么?

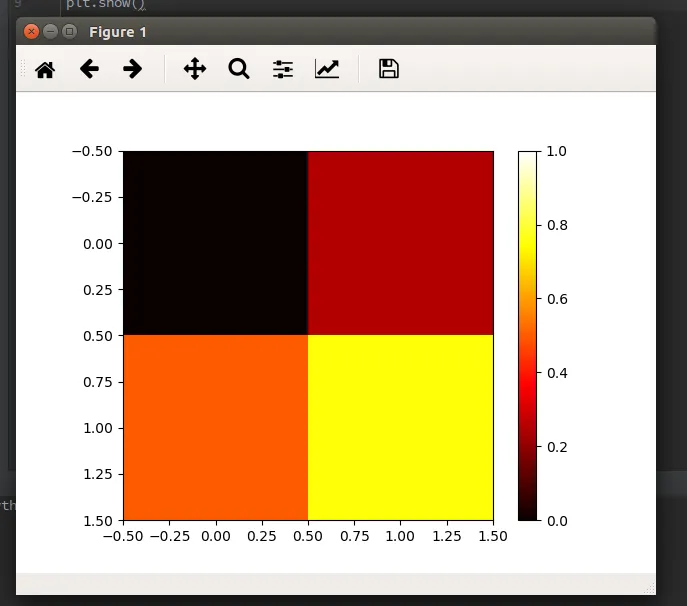
在我的电脑上,matplotlib 的后端似乎没有任何问题。我进行了如下测试:

import matplotlib.pyplot as plt

data = [[0, 0.25], [0.5, 0.75]]

fig, ax = plt.subplots()
im = ax.imshow(data, cmap=plt.get_cmap('hot'), interpolation='nearest',
               vmin=0, vmax=1)
fig.colorbar(im)
plt.show()

并且成功生成了一张图片: 在此输入图片描述

我还尝试了打印X_train[0],看起来没问题。


54
请在您的代码片段末尾添加plt.show() - Marcin Możejko
4
当你从Jupyter复制代码时,经常会出现这个问题。 - arame3333
3个回答

246

解决方案很简单,只需在代码片段末尾添加plt.show()

import numpy as np
np.random.seed(123)
from keras.models import Sequential
from keras.layers import Dense, Dropout, Activation, Flatten
from keras.layers import Convolution2D, MaxPooling2D
from keras.utils import np_utils
from keras.datasets import mnist
(X_train,y_train),(X_test,y_test) = mnist.load_data()
print X_train.shape
from matplotlib import pyplot as plt
plt.imshow(X_train[0])
plt.show()

7
这只是避免回答“为什么”并获得了168个赞...奇怪。 - Kuo
1
2021年3月。在教程https://www.tensorflow.org/tutorials/images/transfer_learning中仍然缺少同样的内容。 - pisoir
@Kuo 原始代码没有绘制图像,因为它没有包含添加的代码行。很简单。当然,标题意味着期望 .imshow 本身会这样做;但回答“为什么调用.imshow不绘制图像?” 的字面意思只能是“因为它没有被定义为执行这样的操作”。自然的后续问题是“如果它不显示图像,为什么要称之为imshow?”,但这是Stack Overflow的离题之谈;我们不会推测matplotlib作者的思考过程。 - Karl Knechtel

53

plt.imshow仅仅是绘制图片而不是打印图片。如果您想要打印图片,只需添加plt.show即可。


27
从这个角度来看,将“imshow”重新命名为“imdraw”会更好,更少引起混淆。你同意吗? - Aram Paronikyan
4
"matplotlib 是一堆混乱和可怕设计的叠层。总有一天人们会转向更好的库(cv2 更加令人困惑)。" - qwr

11

plt.imshow显示图像在坐标轴上,但如果您需要显示多个图像,则使用show()完成图形。下一个示例显示两个图​​形:

plt.imshow 显示图片在坐标轴上,如果您需要显示多张图片,则使用 show() 完成整个图像。下面的例子展示了两个图像:

import numpy as np
from keras.datasets import mnist
(X_train,y_train),(X_test,y_test) = mnist.load_data()
from matplotlib import pyplot as plt
plt.imshow(X_train[0])
plt.show()
plt.imshow(X_train[1])
plt.show()

在Google Colab中,如果您注释掉先前示例中的show()方法,那么只会显示单个图像(与X_train [1]相关联的后一个图像)。

以下是帮助文档的内容:

plt.show(*args, **kw)
        Display a figure.
        When running in ipython with its pylab mode, display all
        figures and return to the ipython prompt.

        In non-interactive mode, display all figures and block until
        the figures have been closed; in interactive mode it has no
        effect unless figures were created prior to a change from
        non-interactive to interactive mode (not recommended).  In
        that case it displays the figures but does not block.

        A single experimental keyword argument, *block*, may be
        set to True or False to override the blocking behavior
        described above.


plt.imshow(X, cmap=None, norm=None, aspect=None, interpolation=None, alpha=None, vmin=None, vmax=None, origin=None, extent=None, shape=None, filternorm=1, filterrad=4.0, imlim=None, resample=None, url=None, hold=None, data=None, **kwargs)
        Display an image on the axes.

Parameters
----------
X : array_like, shape (n, m) or (n, m, 3) or (n, m, 4)
    Display the image in `X` to current axes.  `X` may be an
    array or a PIL image. If `X` is an array, it
    can have the following shapes and types:

    - MxN -- values to be mapped (float or int)
    - MxNx3 -- RGB (float or uint8)
    - MxNx4 -- RGBA (float or uint8)

    The value for each component of MxNx3 and MxNx4 float arrays
    should be in the range 0.0 to 1.0. MxN arrays are mapped
    to colors based on the `norm` (mapping scalar to scalar)
    and the `cmap` (mapping the normed scalar to a color).
网页内容由stack overflow 提供, 点击上面的
可以查看英文原文,
原文链接