如何在Matplotlib柱状图中添加垂直居中的标签

3
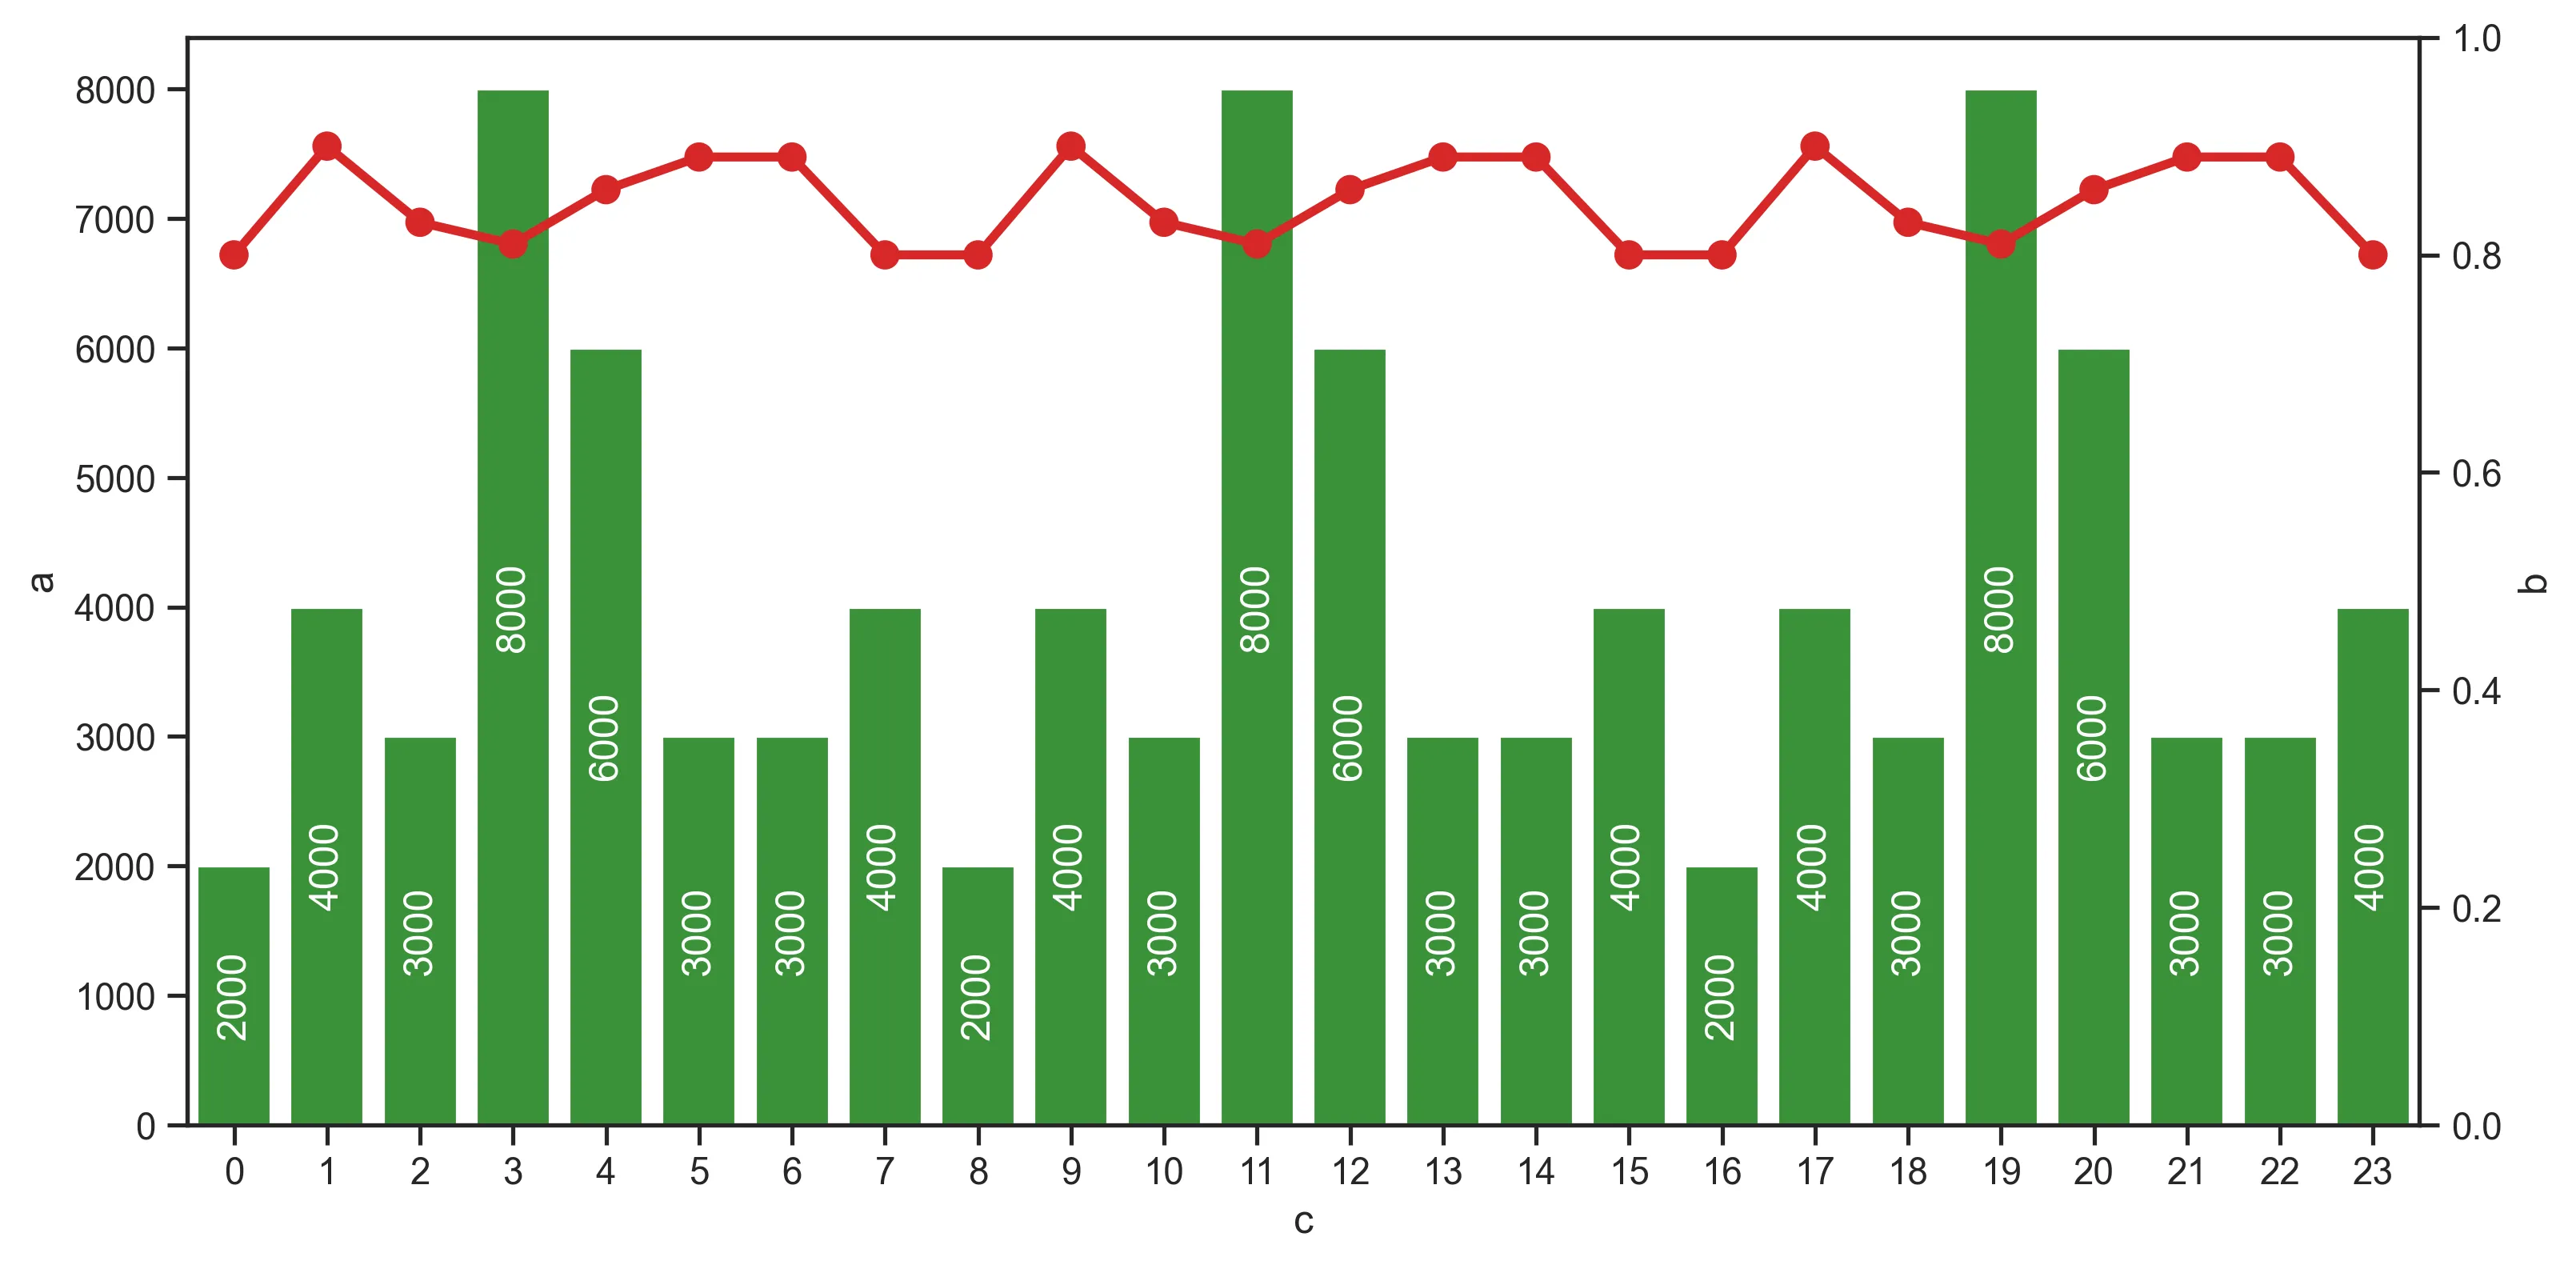
我有一个问题,简化如下:如果有人能向我建议seaborn中的代码以达到我想要的效果,我将不胜感激。
import matplotlib.pyplot as plt


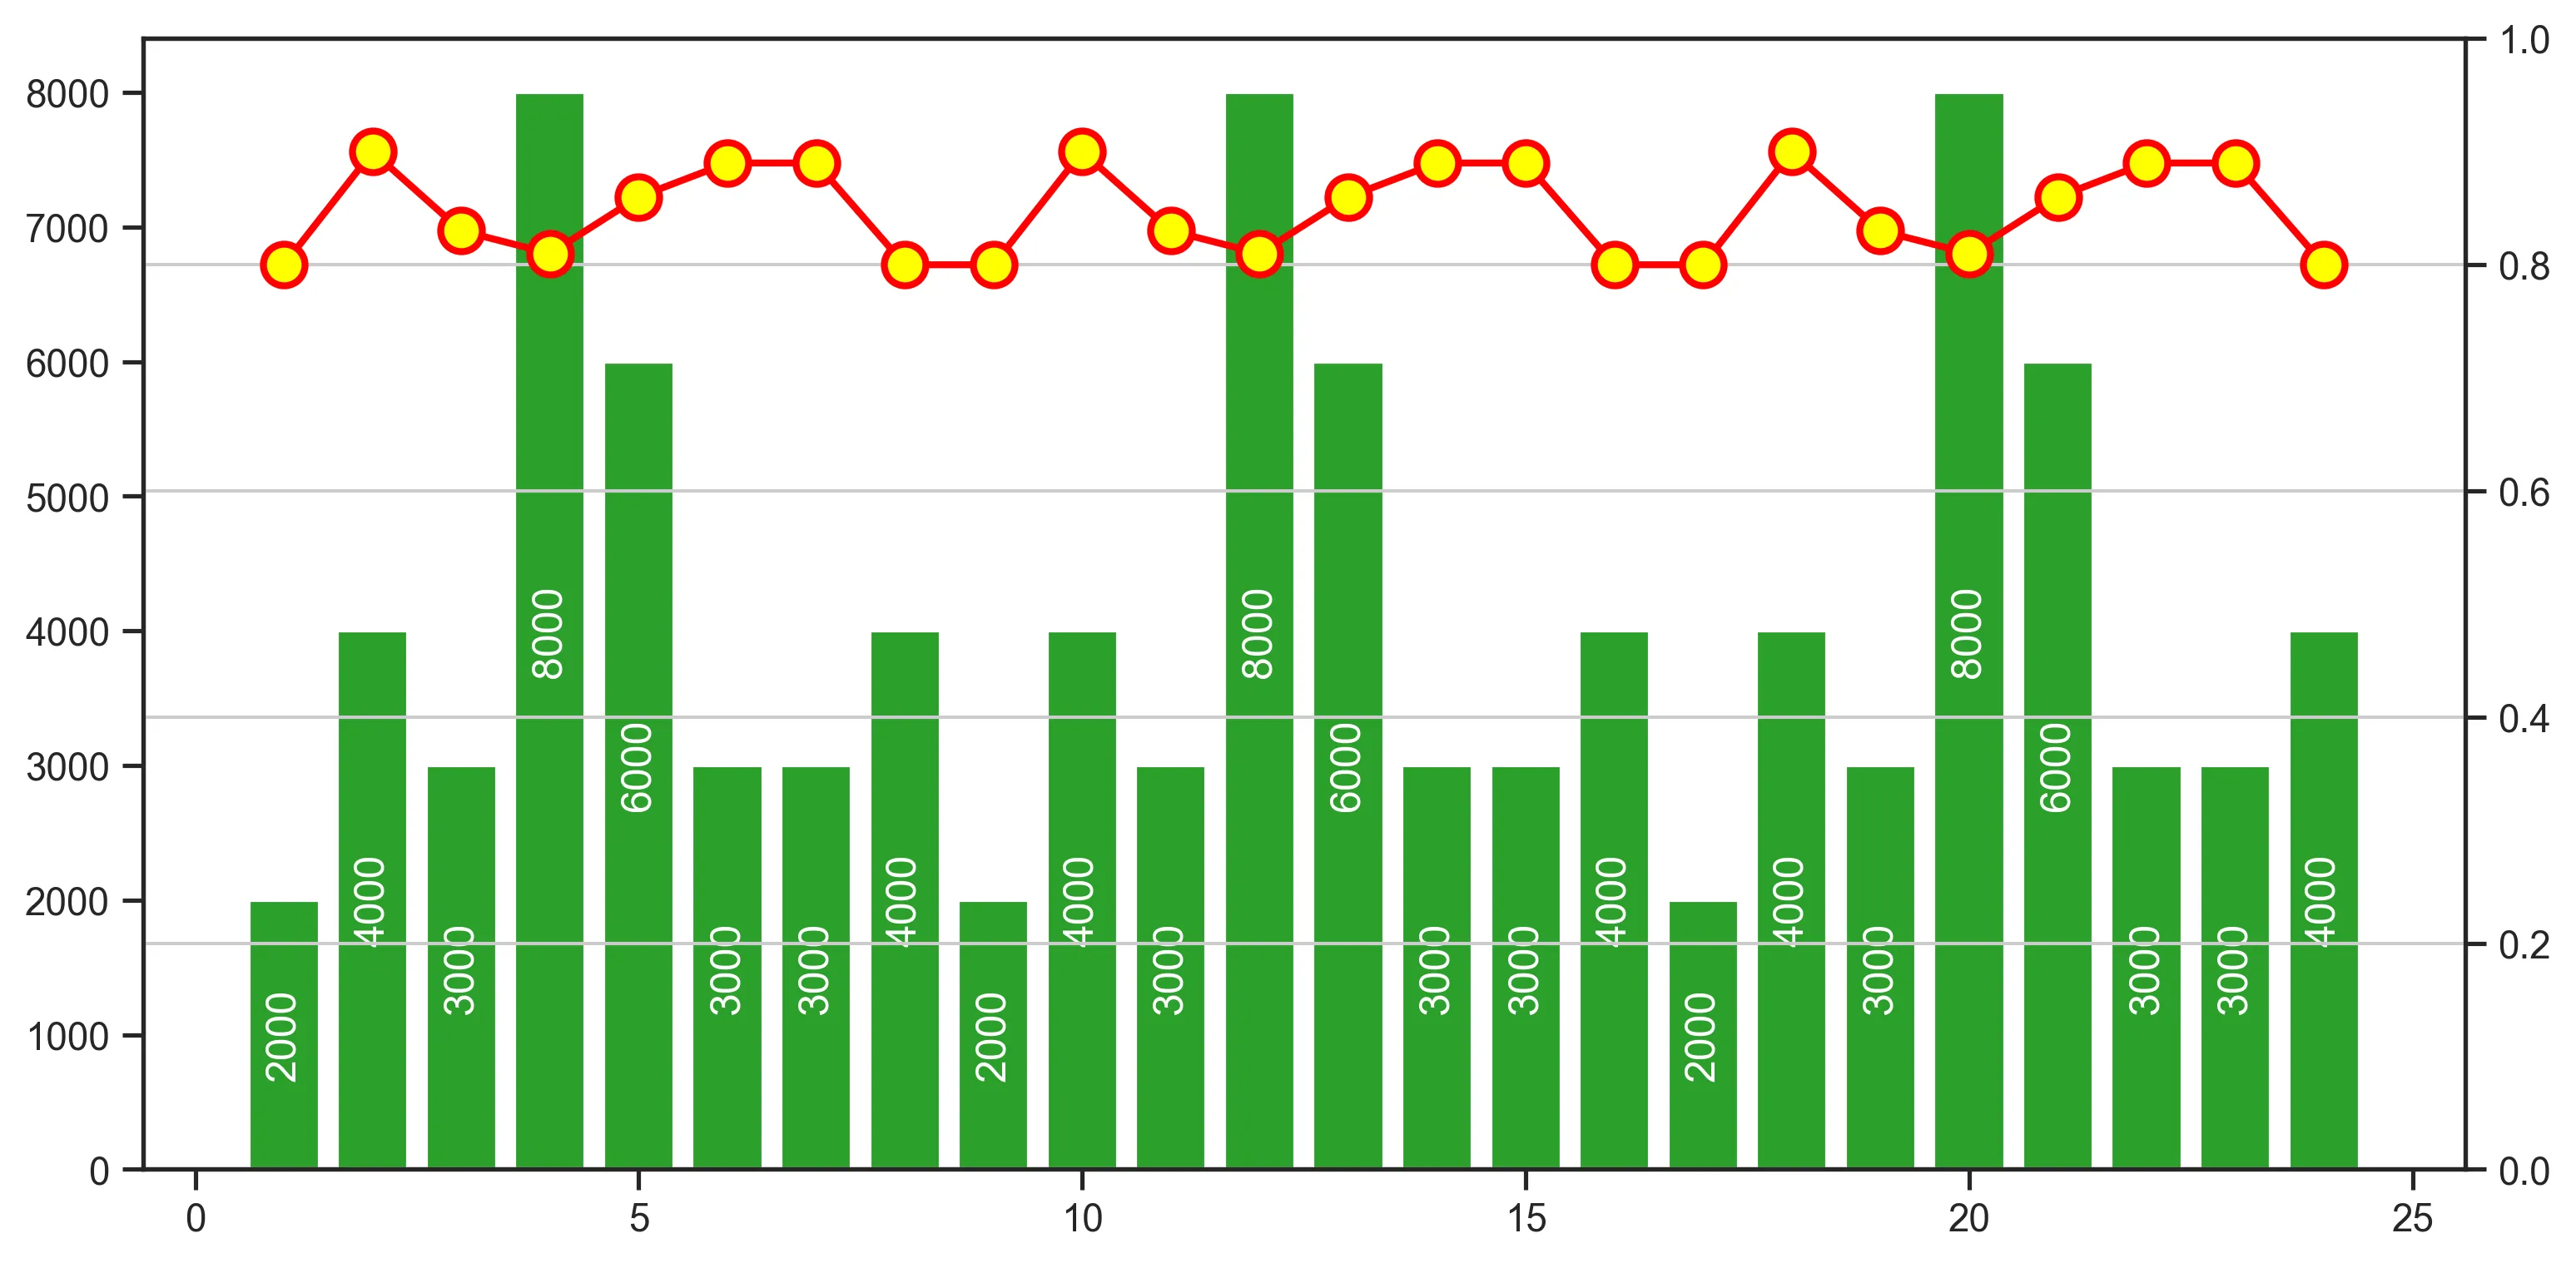
a = [2000, 4000, 3000, 8000, 6000, 3000, 3000, 4000, 2000, 4000, 3000, 8000, 6000, 3000, 3000, 4000, 2000, 4000, 3000, 8000, 6000, 3000, 3000, 4000]
b = [0.8, 0.9, 0.83, 0.81, 0.86, 0.89, 0.89, 0.8, 0.8, 0.9, 0.83, 0.81, 0.86, 0.89, 0.89, 0.8, 0.8, 0.9, 0.83, 0.81, 0.86, 0.89, 0.89, 0.8]
c = [1, 2, 3, 4, 5, 6, 7, 8, 9, 10, 11, 12, 13, 14, 15, 16, 17, 18, 19, 20, 21, 22, 23, 24]

fig1, ax1 = plt.subplots(figsize=(12, 6))
ax12 = ax1.twinx()

ax1.bar(c, a)
ax12.plot(c, b, 'o-', color="red", markersize=12,
          markerfacecolor='Yellow', markeredgewidth=2, linewidth=2)
ax12.set_ylim(bottom=0, top=1, emit=True, auto=False)

plt.grid()
plt.show()

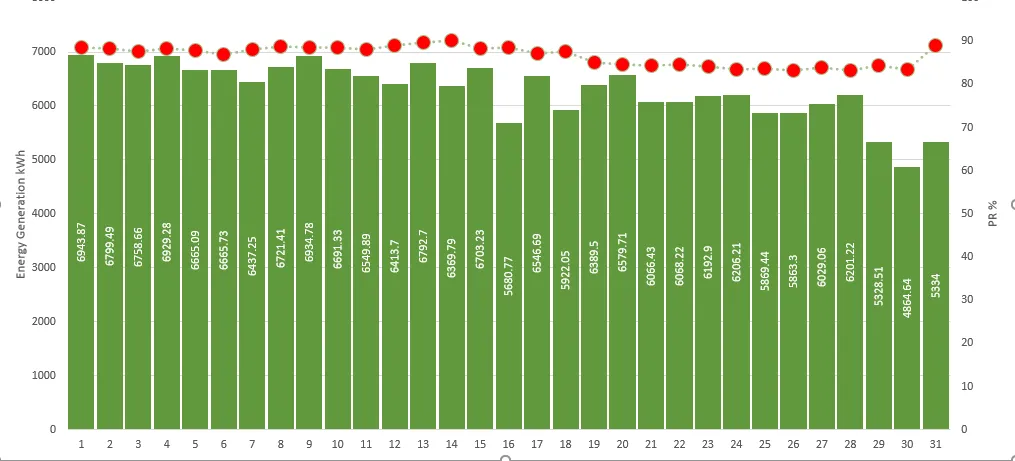
我正在尝试实现标签位于中心并垂直居中,如下图所示。

Desired output

1个回答

4
从matplotlib 3.4.0开始,使用 Axes.bar_label
  • label_type='center' 将标签放置在条形图的中心位置
  • rotation=90 将它们旋转90度
由于这是一个常规的条形图,我们只需要标记一个条形容器 ax1.containers[0]
ax1.bar_label(ax1.containers[0], label_type='center', rotation=90, color='white')

但如果这是一个分组/堆叠条形图,我们应该迭代所有的 ax1.containers

for container in ax1.containers:
    ax1.bar_label(container, label_type='center', rotation=90, color='white')


seaborn版本

我注意到问题文本询问关于seaborn的内容,这种情况下我们可以使用sns.barplotsns.pointplot。我们仍然可以通过底层轴使用bar_label与seaborn

import pandas as pd
import seaborn as sns

# put the lists into a DataFrame
df = pd.DataFrame({'a': a, 'b': b, 'c': c})

# create the barplot and vertically centered labels
ax1 = sns.barplot(data=df, x='c', y='a', color='green')
ax1.bar_label(ax1.containers[0], label_type='center', rotation=90, color='white')

ax12 = ax1.twinx()
ax12.set_ylim(bottom=0, top=1, emit=True, auto=False)

# create the pointplot with x=[0, 1, 2, ...]
# this is because that's where the bars are located (due to being categorical)
sns.pointplot(ax=ax12, data=df.reset_index(), x='index', y='b', color='red')


网页内容由stack overflow 提供, 点击上面的
可以查看英文原文,
原文链接