我希望能在绘图区域内放置标签。
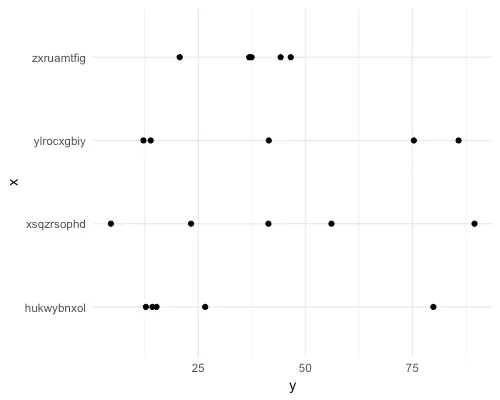
这是一个示例图表:
这是一个示例图表:
library(ggplot2)

set.seed(123)
random_word <- function() paste(sample(letters, 10, replace = T), collapse='')
dat <- data.frame(x = replicate(4, random_word()),
                  y = runif(5*4, 0, 100))

ggplot(dat, aes(x = x, y = y)) +
  geom_point() +
  coord_flip() +
  theme_minimal()
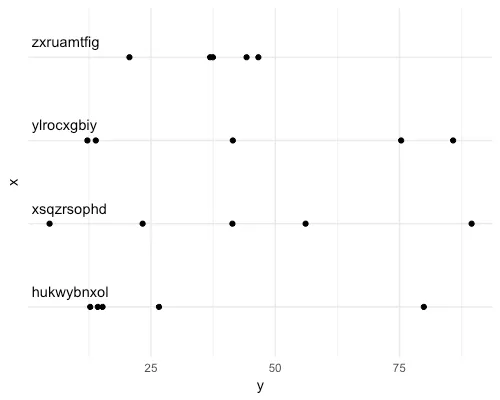
geom_text 来实现我想要的结果:ggplot(dat, aes(x = x, y = y)) +
geom_point() +
geom_text(data = dat[1:4,],
aes(label=x),
y = 1,
hjust=0, vjust=-1 ) +
coord_flip() +
theme_minimal() +
theme(axis.text.y = element_blank())
对于这个问题的评论 [ 移动ggplot轴标签] 表明,在当前的ggplot中,margin 是非hacky的方法,但它似乎不能将轴文本移动到绘图区域内。
# doesn't do the trick
ggplot(dat, aes(x = x, y = y)) +
  geom_point() +
  coord_flip() +
  theme_minimal() +
  theme(axis.title.y = element_text(margin = margin(l = 50)))
有没有一种优雅的方法通过设置theme()参数来获得这种输出结果?
我的sessionInfo()是:
> sessionInfo()
R version 3.5.2 (2018-12-20)
Platform: x86_64-apple-darwin15.6.0 (64-bit)
Running under: macOS Mojave 10.14.3

locale:
[1] en_US.UTF-8/en_US.UTF-8/en_US.UTF-8/C/en_US.UTF-8/en_US.UTF-8

attached base packages:
[1] stats     graphics  grDevices utils     datasets  methods   base

other attached packages:
 [1] ggthemes_4.1.0  forcats_0.4.0   stringr_1.4.0   dplyr_0.8.0.1   purrr_0.3.1     readr_1.3.1
 [7] tidyr_0.8.3     tibble_2.0.1    ggplot2_3.1.0   tidyverse_1.2.1
axis.text.y,这样当您测试该注释并且它不起作用时,实际上您甚至没有更改正确的元素,但这不是主要问题。margin()明显会更改边距。标签仍然会在轴线和绘图边框之间的区域中打印,因此 margin 无法将标签带到图内。 除非有像顶部/底部/等位置绘图的选项(例如scale_x_discrete(position = "inside"))那样的选项,我不知道有没有,所以我猜您最好的选择是使用您的 hacky 解决方案。 - M--