1个回答
18
如果您使用np.histogram来预先计算直方图,就像您发现的那样,您将获得hist数组和bin edges。 plt.bar期望bin的中心位置,因此请使用以下方法进行计算:
如果您使用np.histogram來預先計算直方图,就像您發現的那樣,您將獲得hist數組和bin edges。 plt.bar期望bin的中心位置,因此請使用以下方法進行計算:
xs = (bins[:-1] + bins[1:])/2
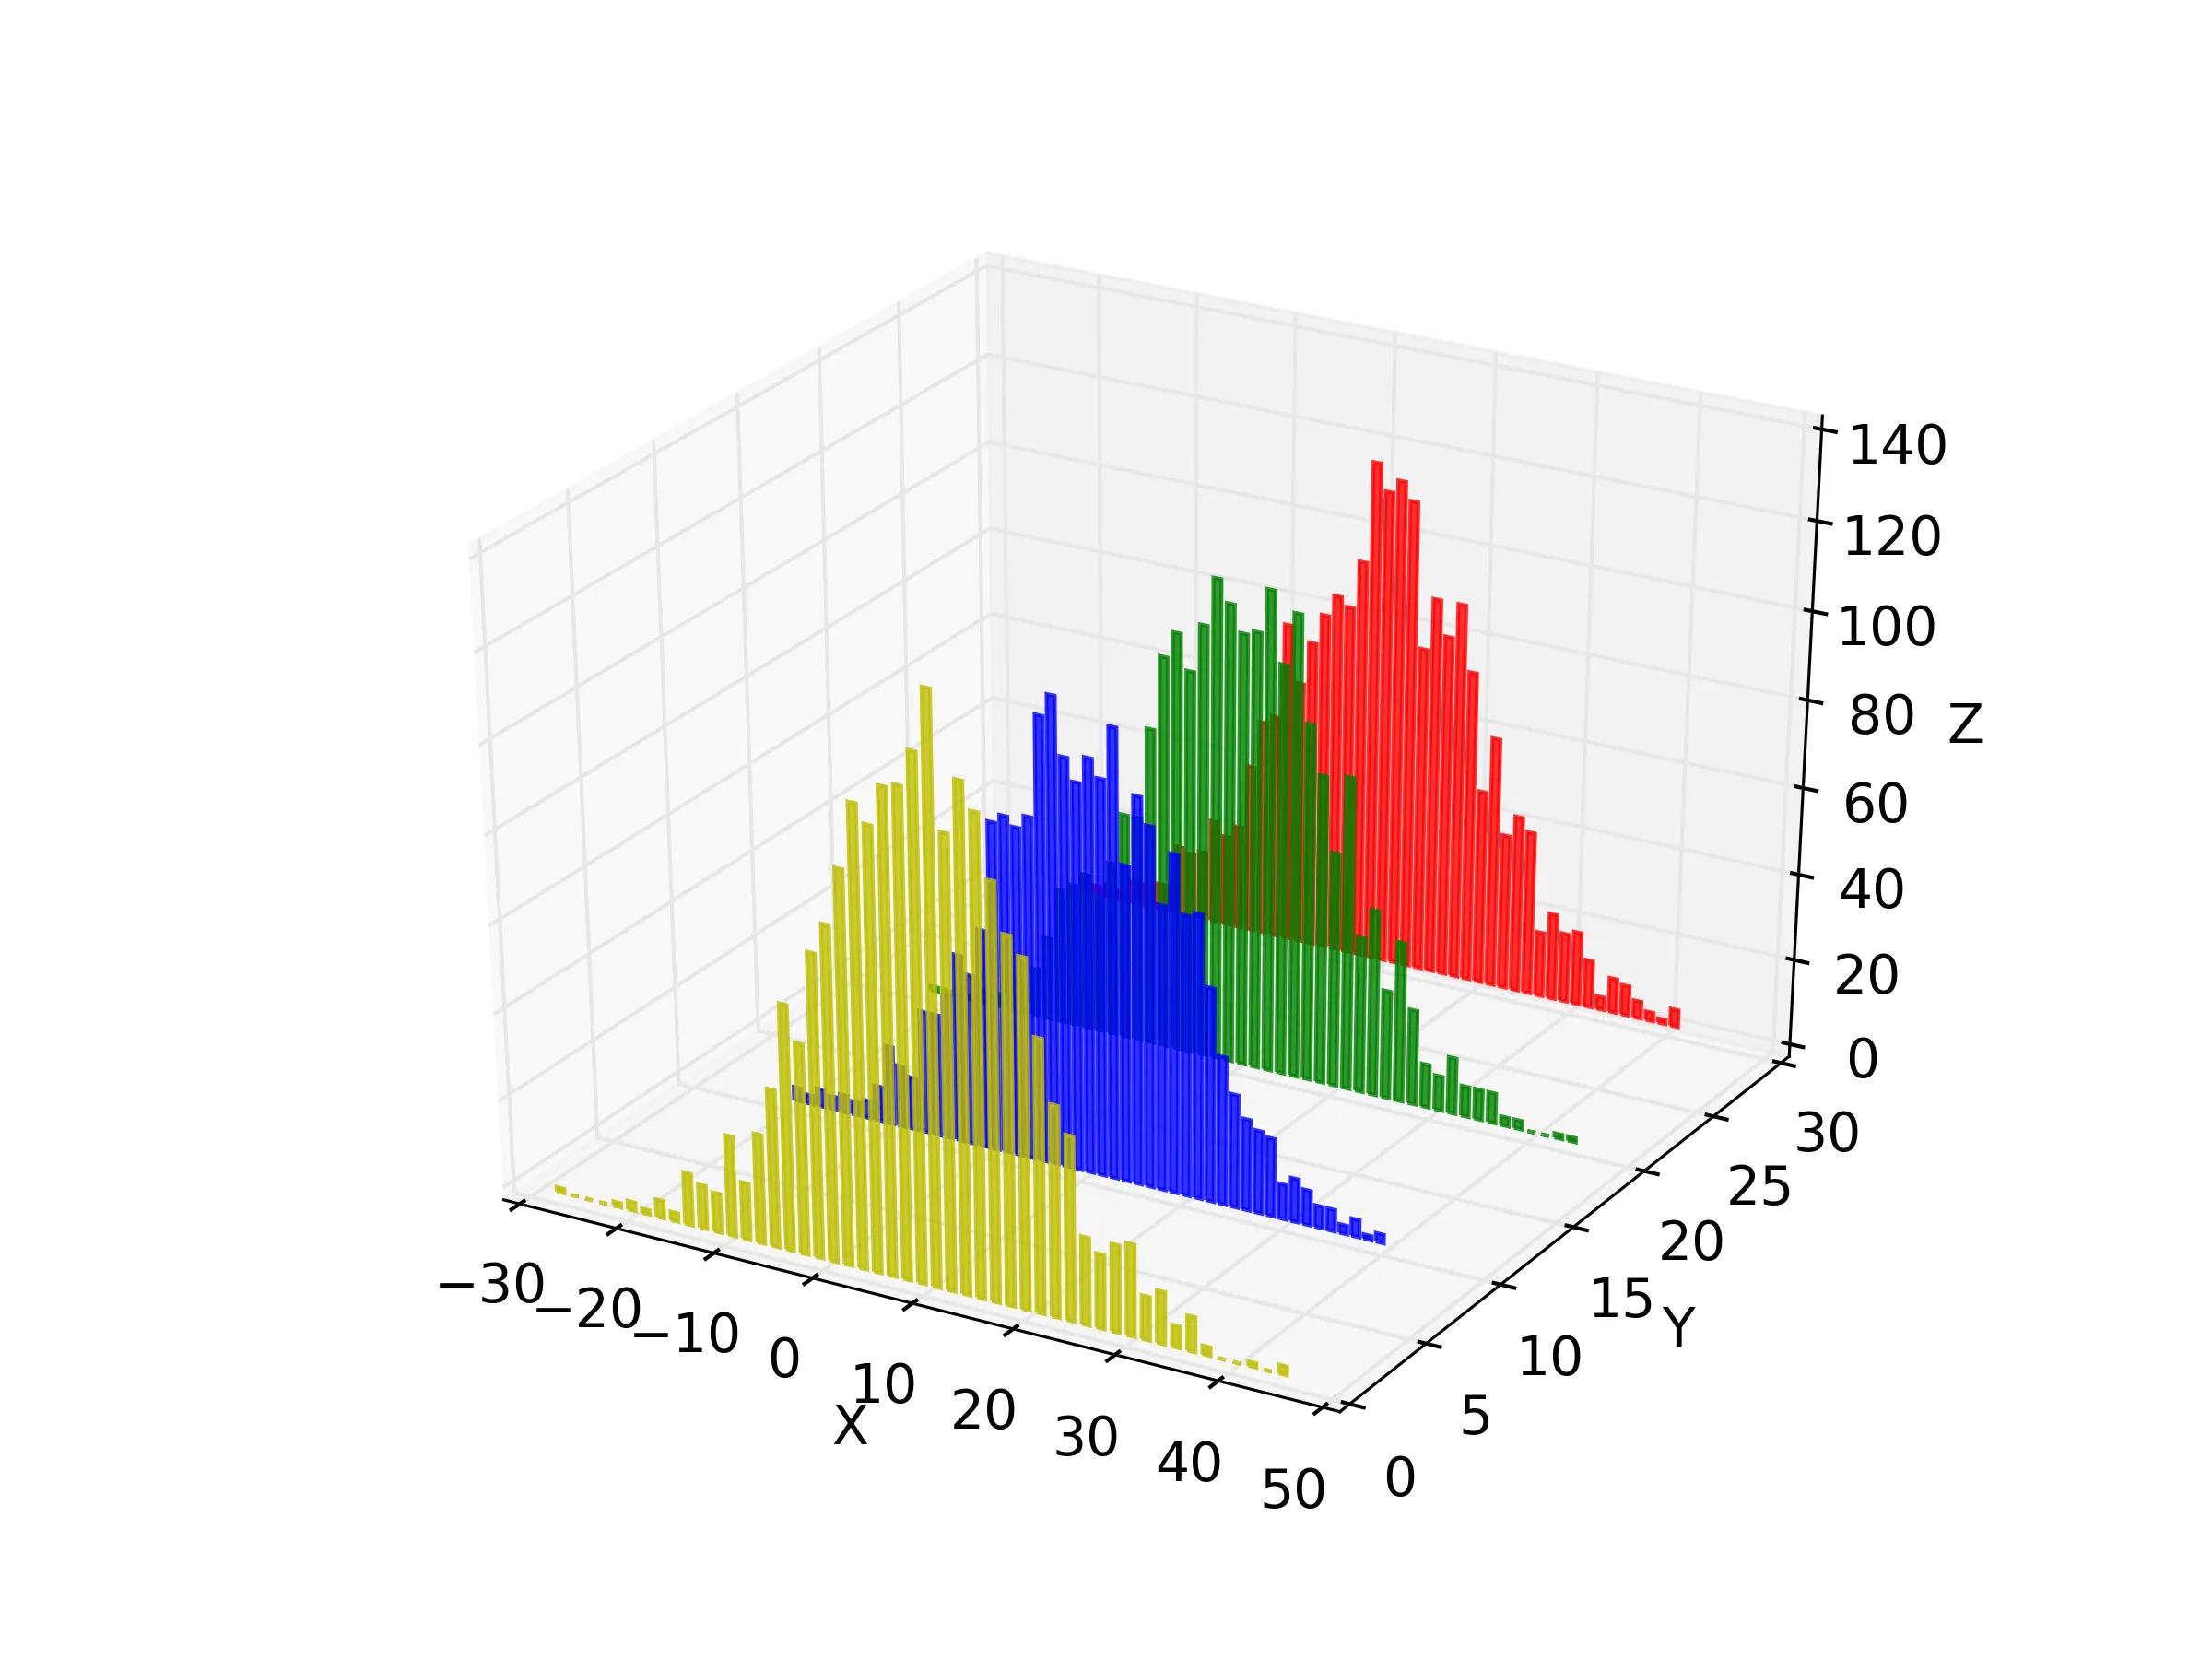
from mpl_toolkits.mplot3d import Axes3D
import matplotlib.pyplot as plt
import numpy as np

fig = plt.figure()
ax = fig.add_subplot(111, projection='3d')
nbins = 50
for c, z in zip(['r', 'g', 'b', 'y'], [30, 20, 10, 0]):
    ys = np.random.normal(loc=10, scale=10, size=2000)

    hist, bins = np.histogram(ys, bins=nbins)
    xs = (bins[:-1] + bins[1:])/2

    ax.bar(xs, hist, zs=z, zdir='y', color=c, ec=c, alpha=0.8)

ax.set_xlabel('X')
ax.set_ylabel('Y')
ax.set_zlabel('Z')

plt.show()
- xnx
1
嗨@xnx,如何将上面的代码适应于箱线图呢?我在包括"zs"和"zdir"等参数时遇到了错误。 - Tomoon
网页内容由stack overflow 提供, 点击上面的可以查看英文原文,
原文链接
原文链接