我有一个简单的代码,用于在Matplotlib中绘制3D点,如下所示 -
from mpl_toolkits.mplot3d import axes3d
import matplotlib.pyplot as plt
import numpy as np
from numpy import genfromtxt
import csv

fig = plt.figure()
ax = fig.add_subplot(111, projection='3d')

my_data = genfromtxt('points1.csv', delimiter=',')
points1X = my_data[:,0]
points1Y = my_data[:,1]
points1Z = my_data[:,2]

## I remove the header of the CSV File.
points1X = np.delete(points1X, 0)
points1Y = np.delete(points1Y, 0)
points1Z = np.delete(points1Z, 0)

# Convert the array to 1D array
points1X = np.reshape(points1X,points1X.size)
points1Y = np.reshape(points1Y,points1Y.size)
points1Z = np.reshape(points1Z,points1Z.size)

my_data = genfromtxt('points2.csv', delimiter=',')
points2X = my_data[:,0]
points2Y = my_data[:,1]
points2Z = my_data[:,2]
## I remove the header of the CSV File.
points2X = np.delete(points2X, 0)
points2Y = np.delete(points2Y, 0)
points2Z = np.delete(points2Z, 0)

# Convert the array to 1D array
points2X = np.reshape(points2X,points2X.size)
points2Y = np.reshape(points2Y,points2Y.size)
points2Z = np.reshape(points2Z,points2Z.size)

ax.plot(points1X, points1Y, points1Z, 'd', markersize=8, markerfacecolor='red', label='points1')
ax.plot(points2X, points2Y, points2Z, 'd', markersize=8, markerfacecolor='blue', label='points2')

plt.show()
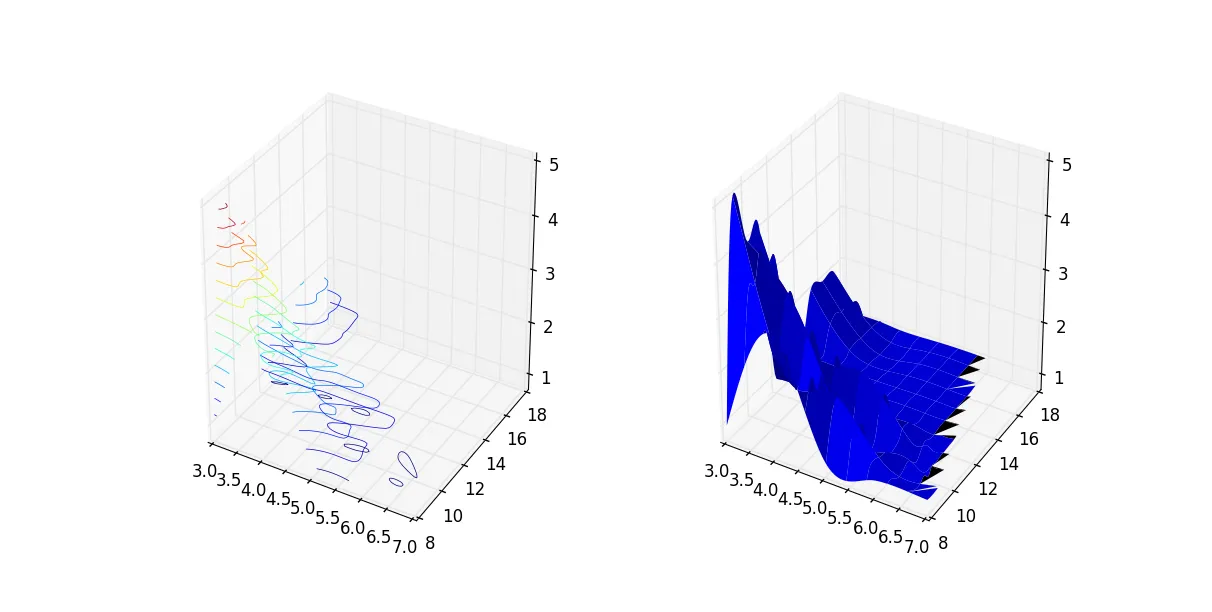
我的问题是,我试图从这些数据点中制作一个体面的表面图。我已经尝试使用
ax.plot_surface()函数使其看起来不错。为此,我排除了一些点,并重新计算了此函数所需的矩阵输入类型。
然而,我生成的图形更加难以解释和理解。因此可能有两种可能性:要么我没有正确使用该函数,要么我试图绘制的数据不适合表面图。我期望的是一个3D图形,它会产生类似于3D饼图的效果。我们看到一个部分(被提取出来的部分)是另一个部分的一部分。我并不希望它完全像那样,但是会有一定的效果。
我想要问的是:
1.你认为能否制作这样的3D图形吗? 2.还有其他更好的方式可以将我的数据表示为三维图形吗?
这是两个文件 -
points1.csv
Dim1,Dim2,Dim3
3,8,1
3,8,2
3,8,3
3,8,4
3,8,5
3,9,1
3,9,2
3,9,3
3,9,4
3,9,5
3,10,1
3,10,2
3,10,3
3,10,4
3,10,5
3,11,1
3,11,2
3,11,3
3,11,4
3,11,5
3,12,1
3,12,2
3,13,1
3,13,2
3,14,1
3,14,2
3,15,1
3,15,2
3,16,1
3,16,2
3,17,1
3,17,2
3,18,1
3,18,2
4,8,1
4,8,2
4,8,3
4,8,4
4,8,5
4,9,1
4,9,2
4,9,3
4,9,4
4,9,5
4,10,1
4,10,2
4,10,3
4,10,4
4,10,5
4,11,1
4,11,2
4,11,3
4,11,4
4,11,5
4,12,1
4,13,1
4,14,1
4,15,1
4,16,1
4,17,1
4,18,1
5,8,1
5,8,2
5,8,3
5,8,4
5,8,5
5,9,1
5,9,2
5,9,3
5,9,4
5,9,5
5,10,1
5,10,2
5,10,3
5,10,4
5,10,5
5,11,1
5,11,2
5,11,3
5,11,4
5,11,5
5,12,1
5,13,1
5,14,1
5,15,1
5,16,1
5,17,1
5,18,1
6,8,1
6,8,2
6,8,3
6,8,4
6,8,5
6,9,1
6,9,2
6,9,3
6,9,4
6,9,5
6,10,1
6,11,1
6,12,1
6,13,1
6,14,1
6,15,1
6,16,1
6,17,1
6,18,1
7,8,1
7,8,2
7,8,3
7,8,4
7,8,5
7,9,1
7,9,2
7,9,3
7,9,4
7,9,5
和points2.csv
Dim1,Dim2,Dim3
3,12,3
3,12,4
3,12,5
3,13,3
3,13,4
3,13,5
3,14,3
3,14,4
3,14,5
3,15,3
3,15,4
3,15,5
3,16,3
3,16,4
3,16,5
3,17,3
3,17,4
3,17,5
3,18,3
3,18,4
3,18,5
4,12,2
4,12,3
4,12,4
4,12,5
4,13,2
4,13,3
4,13,4
4,13,5
4,14,2
4,14,3
4,14,4
4,14,5
4,15,2
4,15,3
4,15,4
4,15,5
4,16,2
4,16,3
4,16,4
4,16,5
4,17,2
4,17,3
4,17,4
4,17,5
4,18,2
4,18,3
4,18,4
4,18,5
5,12,2
5,12,3
5,12,4
5,12,5
5,13,2
5,13,3
5,13,4
5,13,5
5,14,2
5,14,3
5,14,4
5,14,5
5,15,2
5,15,3
5,15,4
5,15,5
5,16,2
5,16,3
5,16,4
5,16,5
5,17,2
5,17,3
5,17,4
5,17,5
5,18,2
5,18,3
5,18,4
5,18,5
6,10,2
6,10,3
6,10,4
6,10,5
6,11,2
6,11,3
6,11,4
6,11,5
6,12,2
6,12,3
6,12,4
6,12,5
6,13,2
6,13,3
6,13,4
6,13,5
6,14,2
6,14,3
6,14,4
6,14,5
6,15,2
6,15,3
6,15,4
6,15,5
6,16,2
6,16,3
6,16,4
6,16,5
6,17,2
6,17,3
6,17,4
6,17,5
6,18,2
6,18,3
6,18,4
6,18,5
7,10,1
7,10,2
7,10,3
7,10,4
7,10,5
7,11,1
7,11,2
7,11,3
7,11,4
7,11,5
7,12,1
7,12,2
7,12,3
7,12,4
7,12,5
7,13,1
7,13,2
7,13,3
7,13,4
7,13,5
7,14,1
7,14,2
7,14,3
7,14,4
7,14,5
7,15,1
7,15,2
7,15,3
7,15,4
7,15,5
7,16,1
7,16,2
7,16,3
7,16,4
7,16,5
7,17,1
7,17,2
7,17,3
7,17,4
7,17,5
7,18,1
7,18,2
7,18,3
7,18,4
7,18,5
 希望这能有所帮助。