以下是我数据的一小部分:
dat <-structure(list(sex = structure(c(1L, 1L, 1L, 1L, 1L, 1L, 1L,
1L, 1L, 1L, 2L, 2L, 2L, 2L, 2L, 2L, 2L, 2L, 2L, 2L), .Label = c("male",
"female"), class = "factor"), A = c(1, 2, 0, 2, 1, 2, 2, 0, 2,
0, 1, 2, 2, 0, 0, 2, 0, 0, 0, 2), B = c(0, 0, 0, 0, 0, 2, 0,
0, 1, 1, 0, 0, 0, 0, 0, 1, 1, 0, 0, 0), C = c(1, 2, 1, 0, 0,
2, 1, 1, 0, 1, 1, 0, 1, 2, 1, 2, 0, 2, 1, 2), D = c(2, 2, 0,
2, 2, 2, 1, 0, 1, 1, 1, 0, 1, 2, 0, 0, 1, 1, 1, 0), E = c(0,
0, 0, 1, 0, 0, 1, 0, 0, 1, 0, 0, 0, 2, 0, 0, 0, 1, 2, 2), F = c(2,
2, 1, 2, 1, 2, 2, 0, 1, 2, 0, 1, 2, 2, 0, 1, 2, 2, 2, 2)), .Names = c("sex",
"A", "B", "C", "D", "E", "F"), variable.labels = structure(c("sex",
"zenuwac", "panieke", "gespann", "rustelo", "angstig", "onzeker"
), .Names = c("sex", "anx01", "anx02", "anx03", "anx04", "anx05",
"anx06")), codepage = 20127L, row.names = c(NA, 20L), class = "data.frame")
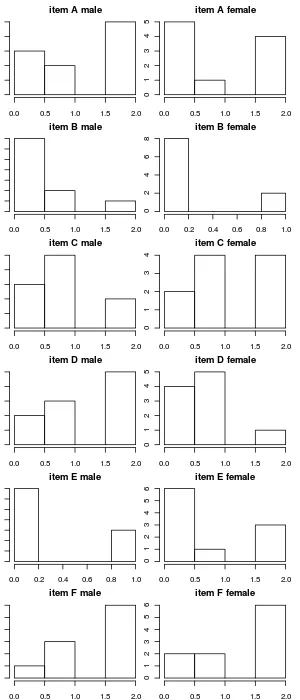
一个数据框,其中包含男性和女性在六个3点变量上的分数。现在我想创建一个图表,该图表显示男性和女性在一个网格中每个变量的分数直方图。例如,我可以这样做:
layout(matrix(1:12,6,2,byrow=TRUE))
par(mar=c(2,1,2,1))
for (i in 1:6) for (s in c("male","female")) hist(dat[dat$sex==s,i+1],main=paste("item",names(dat)[i+1],s))
导致如下结果:
我可以让它看起来更好,但我更想学习如何使用ggplot2。所以我的问题是,如何使用ggplot2创建一个漂亮的版本?我已经尝试了一件事情:
library("ggplot2")
grid.newpage()
pushViewport(viewport(layout = grid.layout(6, 2)))
for (s in 1:2)
{
    for (i in 1:6)
    {
        p <- qplot(dat[dat$sex==c("male","female")[s],i+1]+0.5, geom="histogram", binwidth=1)
        print(p, vp = viewport(layout.pos.row = i, layout.pos.col = s))
    }
}
但我猜应该有一个更简单的方法吧?
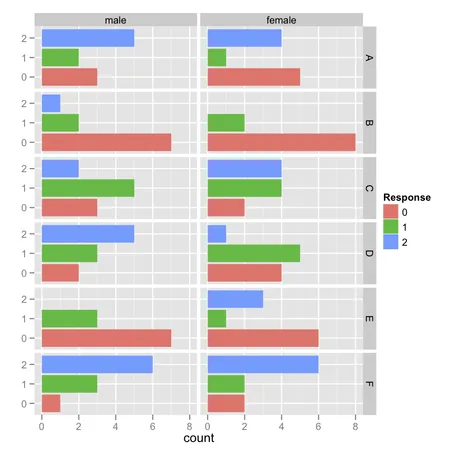
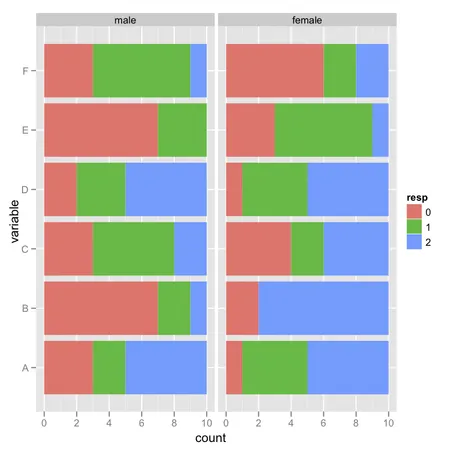
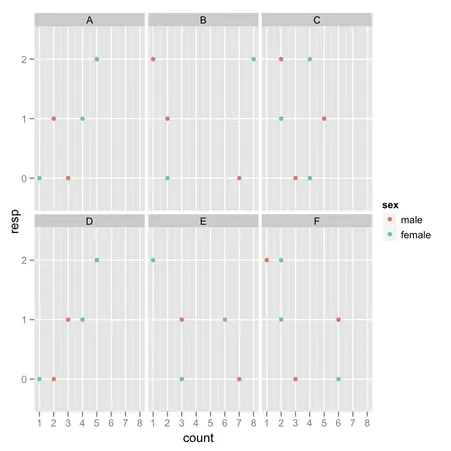
ggplot(subset(melt(dat), as.numeric(variable)==i), aes(x=as.factor(value))) + geom_bar() + facet_grid (. ~ sex) + xlab("")的东西(在关于variable级别的 for 循环内)。将value转换为因子可以避免杂乱的 x 单位。 - chlvalue转换成因子是个好主意。我不确定OP的完整数据集是否会填补这些尴尬的空白,但无论如何,这是一个很好的技巧。 - Chase