维基百科中用哪种颜色渐变来给曼德博集合着色?

29
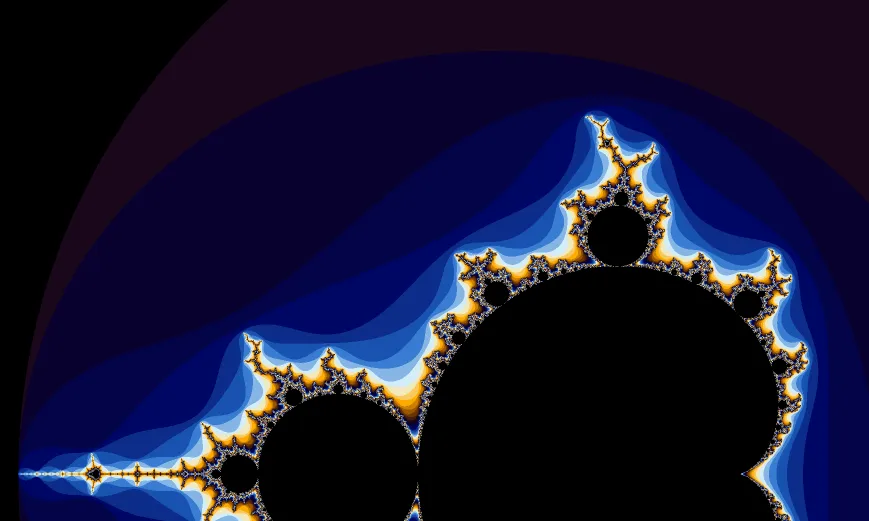
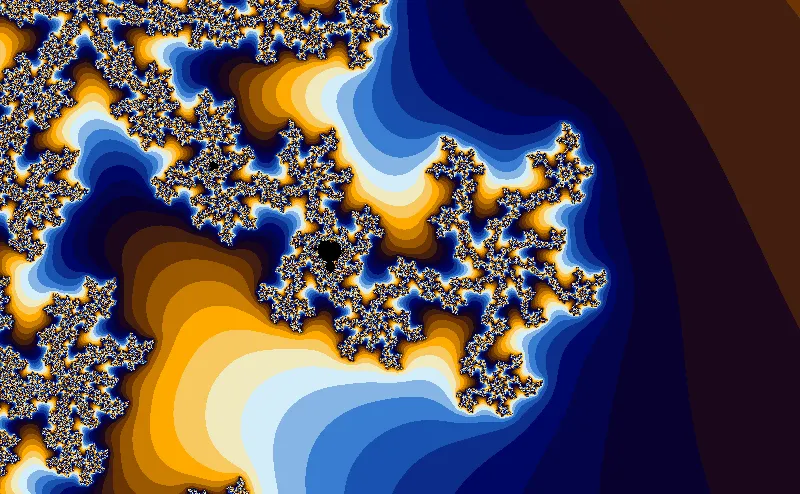
在维基百科的曼德博集合页面上,有曼德博集合真正美丽的生成图像。

Detail Mandelbrot

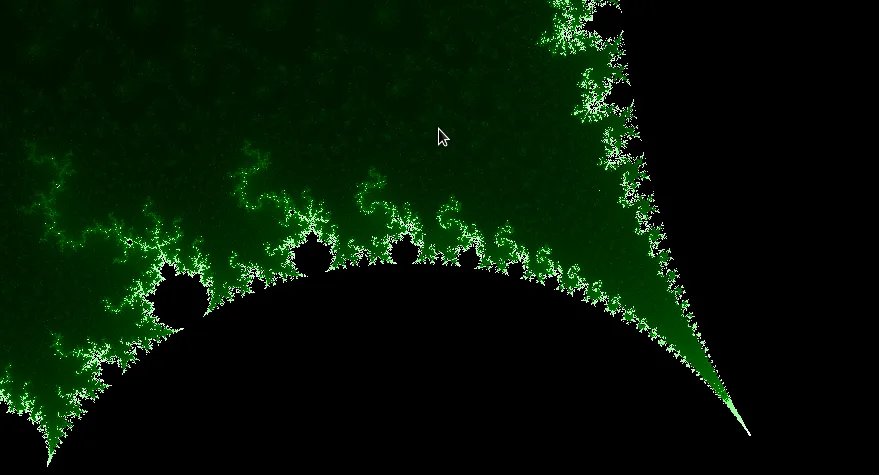
我刚刚实现了自己的曼德博集算法。给定n是用于计算每个像素的迭代次数,我将它们从黑色到绿色再到白色进行简单着色(使用C++和Qt 5.0):

QColor mapping(Qt::white);
if (n <= MAX_ITERATIONS){
    double quotient = (double) n / (double) MAX_ITERATIONS;
    double color = _clamp(0.f, 1.f, quotient);
    if (quotient > 0.5) {
        // Close to the mandelbrot set the color changes from green to white
        mapping.setRgbF(color, 1.f, color);
    }
    else {
        // Far away it changes from black to green
        mapping.setRgbF(0.f, color, 0.f);
    }
}
return mapping;

我的结果看起来像这样:

enter image description here

我已经非常喜欢它了,但维基百科中的图片使用哪种颜色渐变?如何在给定迭代次数的情况下计算该渐变?(此问题与smoothing无关。)

https://www.ultrafractal.com/help/index.html?/help/gradients/gradients.html - Adam
4个回答

36

这个渐变可能来自于Ultra Fractal。它由5个控制点定义:

Position = 0.0     Color = (  0,   7, 100)
Position = 0.16    Color = ( 32, 107, 203)
Position = 0.42    Color = (237, 255, 255)
Position = 0.6425  Color = (255, 170,   0)
Position = 0.8575  Color = (  0,   2,   0)

其中Position的范围为 [0, 1),Color的范围为 [0, 255] 的 RGB 值。

需要注意的是,颜色值不是线性插值。颜色插值可能是立方插值(或类似的插值方式)。以下图片显示了线性插值和单调立方插值之间的差异:

线性渐变与立方渐变

如您所见,立方插值可以得到更平滑、更“漂亮”的渐变效果。我使用单调立方插值来避免因立方插值而造成[0,255]颜色范围溢出的问题。单调立方插值确保插值后的值始终在输入点的范围内。

我使用以下代码来计算第 i 次迭代的颜色:

double smoothed = Math.Log2(Math.Log2(re * re + im * im) / 2);  // log_2(log_2(|p|))
int colorI = (int)(Math.Sqrt(i + 10 - smoothed) * gradient.Scale) % colors.Length;
Color color = colors[colorI];

其中i表示发散的迭代次数,reim表示发散的坐标,gradient.Scale为256,colors是预先计算的渐变颜色数组,在上面显示。在这种情况下,它的长度为2048。


我很难理解如何插值颜色。是否应该预先计算所有2048个colors[colorI] - Bob
@Mikhail 是的,出于性能考虑,我已经预先计算了所有颜色。但是,你可以实时插值,这取决于你自己。你需要自己编写单调三次插值函数。我使用维基链接作为指南。 - NightElfik
位置为1.0和位置为0.0的颜色相同吗? - Adam
位置 = 0.16 颜色 = (66, 107, 203) - Adam
对于任何对色图的技术细节感兴趣的人,请查看此演讲:http://bids.github.io/colormap/ - Wouterr

31

好的,我用Photoshop中的取色器对维基百科中使用的颜色进行了一些反向工程。这个渐变中有16种颜色:

  R   G   B
 66  30  15 # brown 3
 25   7  26 # dark violett
  9   1  47 # darkest blue
  4   4  73 # blue 5
  0   7 100 # blue 4
 12  44 138 # blue 3
 24  82 177 # blue 2
 57 125 209 # blue 1
134 181 229 # blue 0
211 236 248 # lightest blue
241 233 191 # lightest yellow
248 201  95 # light yellow
255 170   0 # dirty yellow
204 128   0 # brown 0
153  87   0 # brown 1
106  52   3 # brown 2

使用模数和 QColor 数组便可迭代渐变中的所有颜色:

if (n < MAX_ITERATIONS && n > 0) {
    int i = n % 16;
    QColor mapping[16];
    mapping[0].setRgb(66, 30, 15);
    mapping[1].setRgb(25, 7, 26);
    mapping[2].setRgb(9, 1, 47);
    mapping[3].setRgb(4, 4, 73);
    mapping[4].setRgb(0, 7, 100);
    mapping[5].setRgb(12, 44, 138);
    mapping[6].setRgb(24, 82, 177);
    mapping[7].setRgb(57, 125, 209);
    mapping[8].setRgb(134, 181, 229);
    mapping[9].setRgb(211, 236, 248);
    mapping[10].setRgb(241, 233, 191);
    mapping[11].setRgb(248, 201, 95);
    mapping[12].setRgb(255, 170, 0);
    mapping[13].setRgb(204, 128, 0);
    mapping[14].setRgb(153, 87, 0);
    mapping[15].setRgb(106, 52, 3);
    return mapping[i];
}
else return Qt::black;

结果看起来很像我所期望的:

曼德博集合

:)


2
我相信它们是Ultra Fractal中的默认颜色。 评估版附带了许多参数的源代码,我认为其中包括该颜色映射(如果您无法从首页的屏幕截图中推断出来)以及可能还包括动态缩放该颜色映射以适应每个场景的逻辑。

0

这是对NightElfik的出色回答的扩展。

Python库Scipy在1.5.2版本中具有pchip_interpolate的单调立方插值方法。我在下面包含了我用来创建梯度的代码。我决定包含小于0和大于1的辅助值,以帮助插值从末尾到开头环绕(没有锐角)。

#set up the control points for your gradient
yR_observed = [0, 0,32,237, 255, 0, 0, 32]
yG_observed = [2, 7, 107, 255, 170, 2, 7, 107]
yB_observed = [0, 100, 203, 255, 0, 0, 100, 203]

x_observed = [-.1425, 0, .16, .42, .6425, .8575, 1, 1.16]

#Create the arrays with the interpolated values
x = np.linspace(min(x_observed), max(x_observed), num=1000)
yR = pchip_interpolate(x_observed, yR_observed, x)
yG = pchip_interpolate(x_observed, yG_observed, x)
yB = pchip_interpolate(x_observed, yB_observed, x)

#Convert them back to python lists
x = list(x)
yR = list(yR)
yG = list(yG)
yB = list(yB)

#Find the indexs where x crosses 0 and crosses 1 for slicing
start = 0
end = 0
for i in x:
    if i > 0:
        start = x.index(i)
        break

for i in x:
    if i > 1:
        end = x.index(i)
        break

#Slice away the helper data in the begining and end leaving just 0 to 1
x = x[start:end]
yR = yR[start:end]
yG = yG[start:end]
yB = yB[start:end]

#Plot the values if you want

#plt.plot(x, yR, color = "red")
#plt.plot(x, yG, color = "green")
#plt.plot(x, yB, color = "blue")
#plt.show()

网页内容由stack overflow 提供, 点击上面的
可以查看英文原文,
原文链接