据我所了解,这里的问题是
geom_node_text 使用的包
ggrepel 只能访问节点所在的层,而无法“看到”边缘。这使得
ggrepel 不太适合网络(或者我漏掉了什么)。
不幸的是,我也没有一个非常好的解决方案,虽然我一直在寻找。以下是两个建议,可以帮助您(或任何人)更好地使用
ggraph() 进行标注:
1:将文本作为节点
因此,我想到的一个想法是让网络布局算法来为我们完成工作。我创建另一个仅包含标签的节点集合。标签节点仅连接到它们标记的网络中的一个相应节点。我们来试试:
library(dplyr)
library(ggraph)
library(tidygraph)

set.seed(123)

reprex <- tibble(from = sample(1:10, 100, replace = TRUE),
                 to = sample(1:10, 100, replace = TRUE)) %>%
  as_tbl_graph() %>%
  activate(edges) %>%
  mutate(color = "grey")
我在这里添加了边缘颜色灰色,因为我们最终的图表将有两种不同的颜色。
nodes <- reprex %>%
activate(nodes) %>%
as_tibble()
labels <- tibble(from = 1:10,
to = 11:20) %>%
as_tbl_graph() %>%
activate(nodes) %>%
mutate(label1 = "label",
is_label = !name %in% nodes$name) %>%
activate(edges) %>%
mutate(color = "black")
new_graph <- graph_join(labels, reprex, by = "name")
现在我们有了带标签节点的新图,可以进行绘制。请注意,我向新图添加了一个变量
is_label,以便我们可以使用不同的节点形状,并确保只有标签节点被标记:
reprex_plot <- new_graph %>%
  ggraph() +
  geom_edge_link(aes(color = color)) +
  geom_node_point(aes(filter = !is_label, shape = "circle"), show.legend = FALSE) +
  scale_edge_color_identity() +
  geom_node_text(aes(filter = is_label, label = label1), hjust = -0.1) +
  theme_void()
reprex_plot
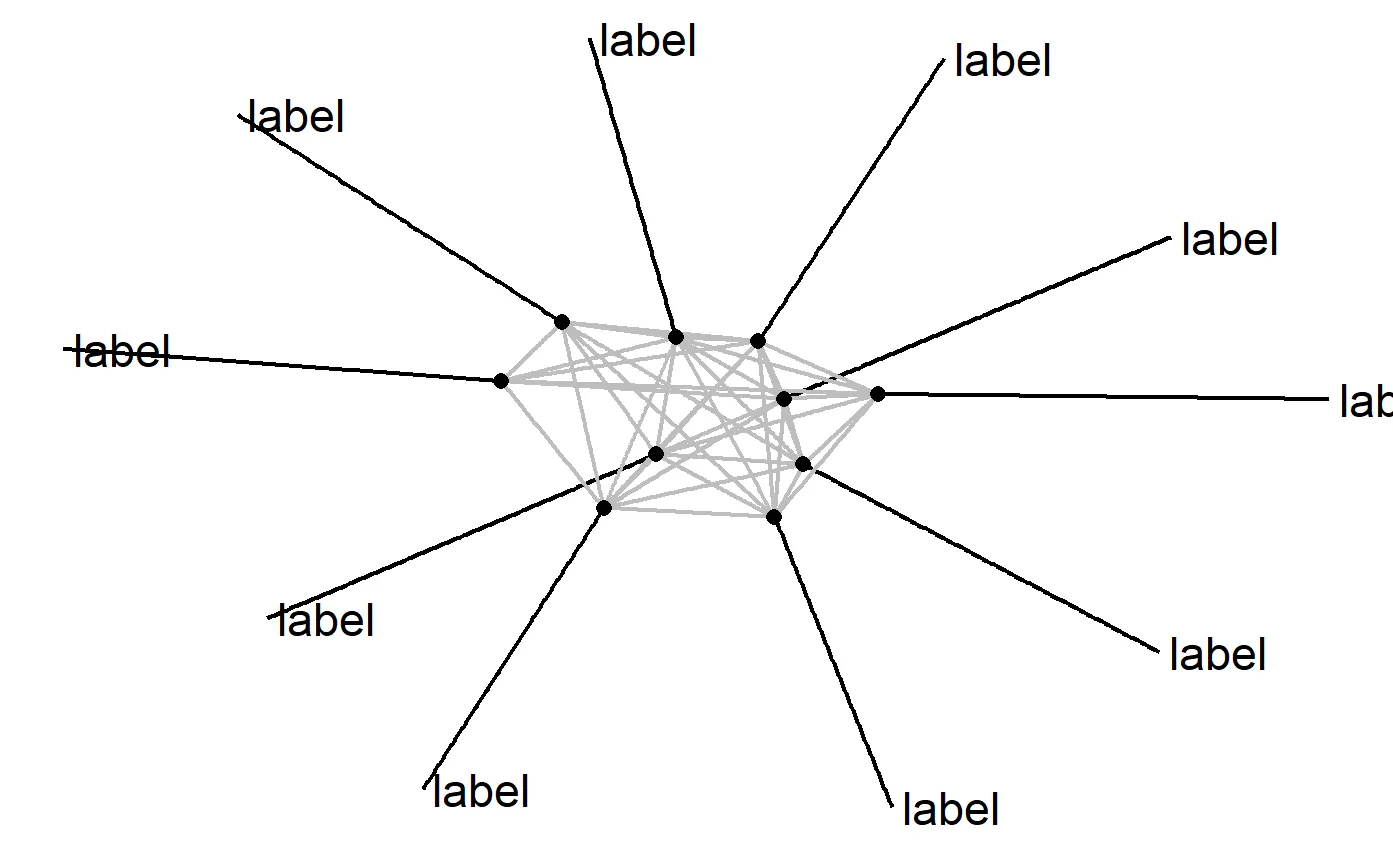
显然,还有很大的改进空间。标签现在与节点非常远。它们仍会与自己的边重叠(虽然通过提供更好的hjust值可以解决这个问题)。虽然这在自动布局中很有效,但是其他布局可能会因为您的数据而产生奇怪的效果。我真的希望有人能提出更好的解决方案。但我认为我也可以把它放在这里。也许有人会感到灵感。
2:使用标签代替文本
另一种解决方法是在文本上使用白色背景。此解决方案受到网络绘图GUI程序处理问题的启发。我们可以使用ggplot2的geom_label,尽管geom_node_label()也能实现同样的效果。这种解决方案更为直接,但也有限制。下面是整个过程的代码:
tibble(from = sample(1:10, 100, replace = TRUE),
       to = sample(1:10, 100, replace = TRUE))  %>%
  as_tbl_graph() %>%
  activate(nodes) %>%
  mutate(label1 = "label") %>%
  ggraph() +
  geom_edge_link(color = "grey") +
  geom_node_point() +
  geom_label(aes(x = x, y = y, label = label1), nudge_y = 0.1, label.size = NA) +
  theme_void()
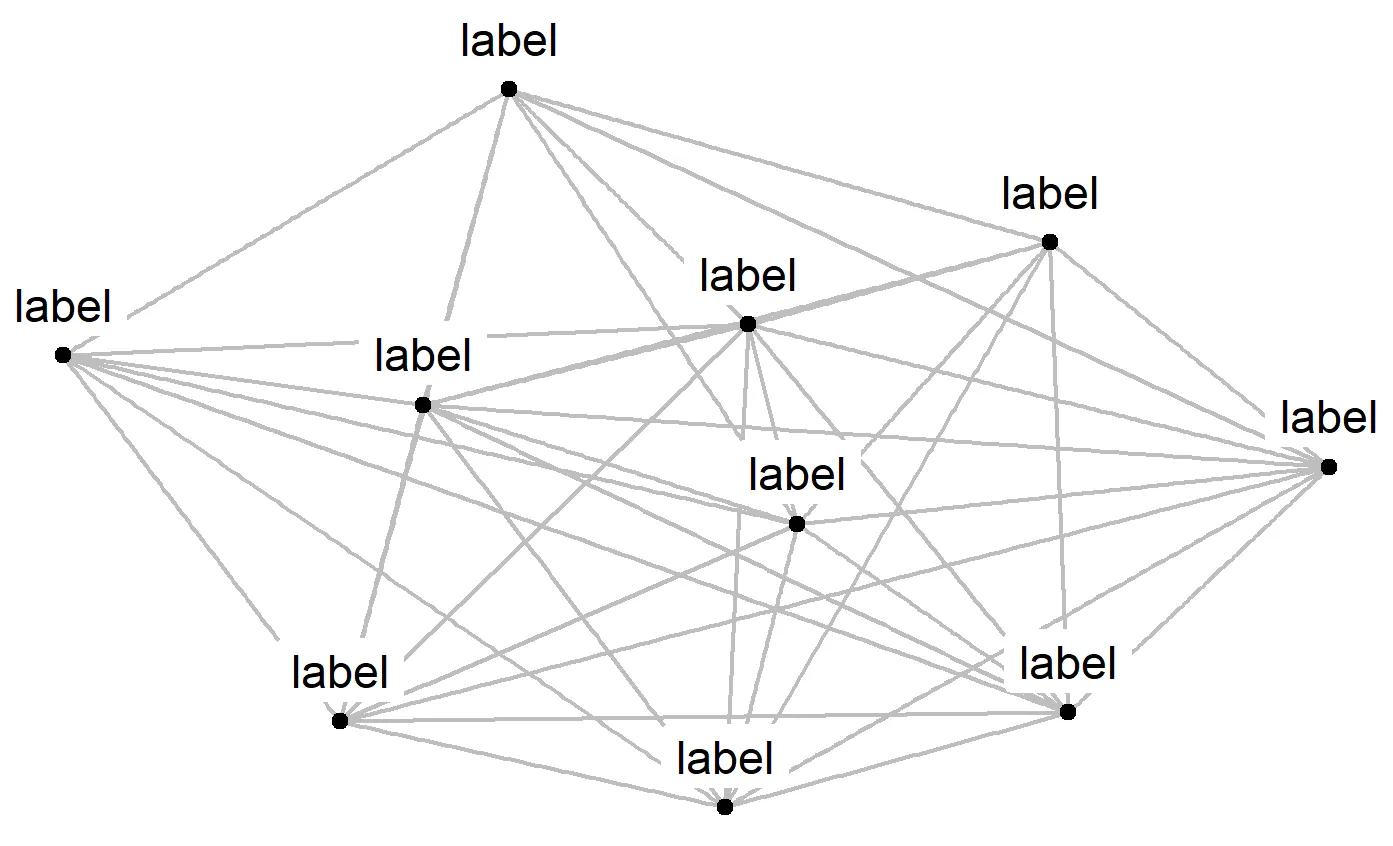
我移除了标签的边框,并将它们直接放在它们的节点上方(
nudge_y = 0.1)。由于绘图大小的不同,你的结果可能会有所不同,因此你可能需要更改该值。
在较大的网络中,标签的白色框可能会盖住其他节点。
