是的,你可以在大多数geom_edge_*中使用widthaes来实现这一点。此外,你可以使用scale_edge_width根据加权变量微调最小/最大宽度。请参见下面的两个示例。
另外,我认为这个美学问题与ggforce有关(这也给我带来了麻烦)。确保你已经更新到最新版本的ggraph和ggforce。
library(ggraph)
library(igraph)
data=data.frame(w1=rep('like', 5),
                w2 = c('apple', 'orange', 'pear','peach', 'banana'),
                weight= c(2,3,5,8, 15))
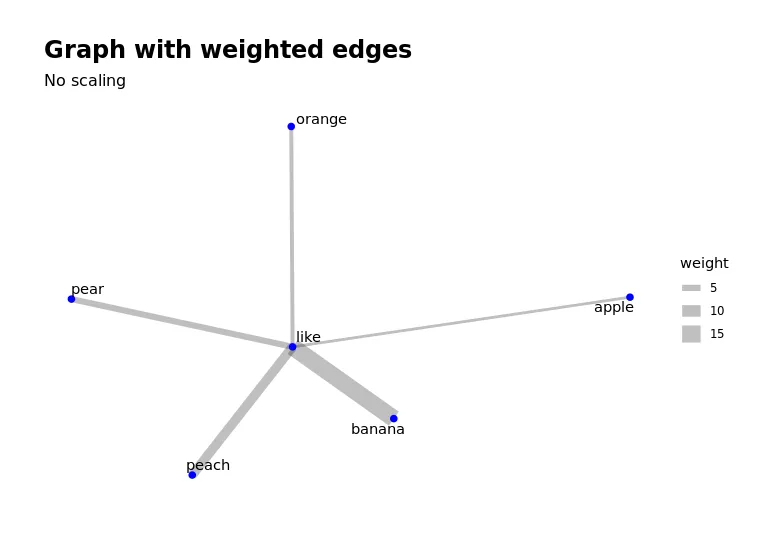
第一个使用默认权重
data %>%
  graph_from_data_frame() %>%
  ggraph(layout = "fr") +
  geom_edge_link(alpha = .25,
                 aes(width = weight)) +
  geom_node_point(color = "blue", size = 2) +
  geom_node_text(aes(label = name),  repel = TRUE)+
  theme_graph()+
  labs(title = 'Graph with weighted edges',
       subtitle = 'No scaling')
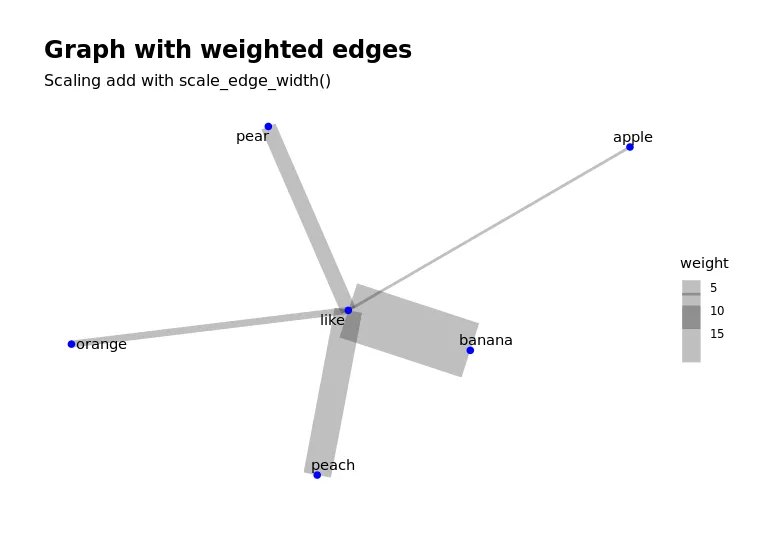
使用
scale_edges_width来设置范围。
注意-
scale_edges*可以接受多个参数。
data %>%
graph_from_data_frame() %>%
ggraph(layout = "fr") +
geom_edge_link(alpha = .25,
aes(width = weight)) +
geom_node_point(color = "blue", size = 2) +
geom_node_text(aes(label = name), repel = TRUE)+
scale_edge_width(range = c(1, 20))+
theme_graph()+
labs(title = 'Graph with weighted edges',
subtitle = 'Scaling add with scale_edge_width()')
geom_edge_link的文档吗?它们清楚地列出了edge_width作为可以与此 geom 一起使用的审美之一。 - camilleaes中的数据并传递给该geom的mapping。geom_edge_link也不例外。edge_width是其中之一的美学。 - camille